We live in an age where the impacts of climate change are seen daily. Data on global and local conditions is vital to our further understanding of adaptability and resilience both as protection from storms as well as mitigating longer term impacts. While understanding where we’re at in modern times is essential, comparing that to historical reference conditions connects threads from past to present and enlivens this discussion. Thus in the spirit of hidden hydrology and linkage to climate and rainfall, I was fascinated to learn about the book Climatology of the United States, And of the Temperate Latitudes of the North American Continent, authored by Lorin Blodget in 1857. This is interesting as it coincides with much of the development of Pacific Northwest cities in the mid 1850s so is a good indication of some predevelopment metrics, but more importantly is towards the beginning of the global Industrial Revolution (centered in London and radiating outwards), which led to rapid increase in development of industrial infrastructure and processes that created significant amounts of atmospheric CO2, which is arguably one of the biggest contributors to climate change.
This volume is 569 pages, packed full of info (and a massive PDF also). Most interesting to me and the original link i found was the amazing maps (abbreviated viewer here of the maps from the publication if you don’t want to download the whole thing) covering the world and specifically covering the temperate landscape of the Northern Hemisphere, with a focus on North America. In the introduction, some rationale for the project from Blodget.
I’m assumed he was referring to Alexander von Humboldt, but had missed the reference and probably would if he wouldn’t have mentioned it above. After some digging I noticed a deft reference in ‘The Humboldt Current: Nineteenth Century Exploration and the Roots of American Environmentalism’ (Aaron Sachs, 2007). Sachs links the two, mentioning on page 25-26, “Almost all American scientists in the mid-to-late nineteenth century, no matter what subfields they waded into, considered themselves disciples of Humboldt. One such author, Lorin Blodget, inserted a quote from the master himself on the title page of his own magnum opus, Climatology of the United States, to make a kind of textual frontispiece.”
The quote in small print on the front:
Like Humboldt’s work, the illustrations and summary visualizations of the phenomena he was describing, Climatology includes amazing illustrations (do yourself a favor and click the images in this post to enlarge them. The banner image of global temperatures above in the banner, as well as the world spanning ‘Comparison of Precipitation for the Temperate Latitudes of the Northern Hemisphere’ is Humboldtian indeed:
The smaller diagrammatic maps also evoke Humboldt’s stratification by elevation, captured in Blodget’s ‘Profile of the Altitudes’ for both the Pacific Coast of North America and the West Coast of Europe are some simple info-graphics rich in information and easily accessible.
The main substance of the document is the maps, include temperature (isothermal) and precipitation (hyetal) maps. There is a world view of both – as you’ve seen examples of above, but the focus is on North America, so each season is represented, along with an average annual. Summer and Winter are shown below, the difference being hopefully obvious:
The legend describes the map info, including max. and min. ranges for temps.
And a close-up of the Pacific Northwest shows the level of detail – along with a glimpse at the base map, which is similar, mostly in how topography is represented, to the one well know in the region as the 1859 Map of the state of Oregon and Washington Territory.
We take a lot for granted the amount of data, A challenge of the process was to gather and assimilate diverse information from a variety of sources, due to the fact that there was no consensus on the measurement and documentation of either temperature and rainfall data. Blodget spends a lot of time explaining the process, with a specific focus: “These references are deemed necessary to show that no part of the present work, whether supported by statistics and illustrators or not, was is the result of hasty or superficial discussion, and that all the steps of analytical investigation and detailed criticism required for such a purpose as that of constructing an approximate climatology, have been taken in advance.”
The rainfall maps are interesting as well showing in a variety of data, in shaded portions based on inches of rain. The image for annual totals shows the wetness of the southeast United States and the Pacific Northwest.
Zooming into the Southeast US – we see the intensity of rain in the southern tip of Florida, along with the Mississippi Delta. These are beautiful maps, considering they were done over 150 years ago, and the subtlety of shading and texture represented.
These are best represented in sequence (and i do love a good animation) so I did a quick overlay and made them step through seasons starting in Spring and sequencing through Summer, Autumn and Winter. Note the Pacific Northwest wet winter / dry summer cycle, and the overall difference between the coasts/interior as well as West Coast / East Coast. Somethings don’t change. Click to enlarge to make it a bit more legible.
I’ve yet to dive fully into the text, but have some context in the maps, and a curiosity to see the data at this level of analysis overlaid with modern information on isothermals and hyetals to show changes, in average and seasonal temps, changes in rainfall, and related hydrology and changes in things like plant hardiness ranges. Lots to unpack. While looking at this, I did find an earlier reference by Blodget, a slim volume published in 1853 which also tackles climate in reference to it’s impact on Sanitary conditions in cities, delving into the connections between climate and public health – well, 164 years ago.
The visual nature of the 1857 publication is not to be dismissed. The publisher J.B. Lippencott & Co., acknowledges the rarity of a book of this era having the size of quality plates, and their goal to make this available to the public at a reasonable cost. Such an interesting dilemma in our digital age, but one I’m glad for in terms of the production of this imagery as well as it’s preservation and archive. Just think, all this could have been yours in 1857 for the price of five dollars.
As outlined in my previous post, the San Francisco Bay Area is loaded with many hidden hydrology focused activities and groups working throughout the region. This follow-up post will address the amazing depth of resources available for historical maps and other resources for mapping and exploring lost rivers and buried creeks in the bay area.
The first place to look would be the amazing Guide to San Francisco Bay Area Creeks, which has an amazing array of creek maps covering the entire region, published by the Oakland Museum of California, many of which were also funded by the California State Water Resources Control Board and U.S. Army Corps of Engineers. You can select maps or use a sort of useful Graphic Creek and Watershed Finder to select areas via map.
The site itself isn’t just a portal to information, but includes a lot of maps, historical and contemporary as well as supporting info like Creek’Zine with stories of local history, or a glossary of creek and watershed terms. Each map page offers links to the many creeks either through text or clickable smaller basin maps, like San Francisco.
This scaling linking allows for easy drilling down to subwatersheds, for instance to Islais Creek Watershed in San Francisco. you find more info and specific clickable elements,
Clicking on the map triangles yields more info – ostensibly what is found on the full printed map, but it’s nice to have really easy access to this online, in some depth. An example is found in the link to Glen Canyon:
The key shows the depth of information available, including the basins, man-made and natural drainage infrastructure, waterbodies, fill and other structures.The sidebar has keyed Historical Features, circa 1850 including ‘Creeks, buried or drained’, ‘Ephemeral creeks’ and areas that were filled.
Each map page also links to a number of historic or descriptive maps that outline water systems, topography or juxtapose the new and the old. For Islais Creek, above, a 1896 USGS Topographic map shows some source materials and evolution of the area prior to filling the historical features.
The main excerpt maps are zoomed in versions of the larger printed maps, which are pretty dramatic (in their digital form). This one showing Oakland and Berkeley areas in the East Bay. “The printed version of this map presents both the historical and modern hydroscapes of the western drainages of Northern Alameda County.”
I can stare at these for hours even though I don’t live there, that’s how fascinating they are. Click on the map to download a PDF, (3.0 MB)
An excerpt shows the detail (in this case around Lake Merritt) which is pretty representative of the maps.
I’m still amazed at the coverage of these maps, and although some are getting old, the overlay info should still be pretty accurate even in the boom of development and redevelopment happening in the area. There are maps for purchase and download, along with some GIS and KMZ files for further mapmaking opportunities. As San Francisco proper is (mysteriously?) the only version of the PDF map not downloadable, I purchased a few of the printed maps so will see how they look when they arrive in early January.
As an added bonus, I really liked this animated map showing San Francisco in 1869 and 2007. (will launch in new tab for a bigger version). This shows a simple evolution of the entire city, rotating through 150 years of change. A dramatic difference, I’d say.
An additional find was the Guide to East Bay Creeks, a brief series of essays by Sarah Pollock, Shelby Hall & Christopher Richard. Now only available online, which includes narratives for the specific hydrological and ecology – sort of a regionally specific creeks 101. From the intro:
“Throughout the East Bay city dwellers are recognizing that even in urban areas we have wildlands valuable to humans and other animals. These people are learning ecological relationships through direct experience, and they are hoping that ultimately there may be an attitude shift, a cultural recognition that even city dwellers are an integral part of a living system.”
The previously mentioned San Francisco Estuary Institute, which was responsible for some of the maps available above at the Guide to San Francisco Bay Area Creeks, and is a wealth of information on their site, both in terms of research reports but also GIS information. In their Data Center, you can search for tools, services, visualizations and other resources applicable to resilience and historical ecology among other topics. Their work extends throughout the region, but has many overlaps in the Bay Area, including the GIS data for the Alameda Creek Historical Ecology study mentioned in the previous post, and rich data sets such as The San Francisco Bay Shore Inventory: Mapping for Sea Level Rise dataset provides a comprehensive and consistent picture of today’s Bay shore (up to MHHW + 10ft) for all nine Bay Area counties. These data are available in ESRI ArcGIS file geodatabase and Google Earth KMZ format.”
Building on the last study, the SFEI folks also had a link to an awesome Historical Ecology resource, the online viewer for U.S. Coast Survey Maps of SF Bay, which provides maps of shoreline “Under the direction of some of the leading American scientists of the 19th-century, the USCS created exceptionally accurate and detailed maps of the country’s coastline. In the San Francisco Bay Area, these surveys (commonly referred to as “T-sheets”) are the most important data sources for understanding the physical and ecological characteristics of the Bay’s shoreline prior to Euro-American modification.”
The interface could use an update, but with a bit of digging the T-Sheets are available for download and are rotated and georeferenced, and includes raster and vector files. The image above I rotated and cropped – and you see that, aside from utility, these are some of the most beautiful maps. Another zoomed excerpt.
I’ve dug into the T-Sheets for the Seattle area, and they are some great maps with pretty extensive coverage. A few links provide a good tutorial, including a T-Sheet Users Guide authored by Robin Grossinger, From their summary: “This guide discusses the historical maps of San Francisco Bay produced by the United States Coast Survey (USCS) and their application to present-day environmental efforts in the region.”
There are also Seep City maps, the project mentioned in the previous post, including print maps, atlases, and a forthcoming book available for purchase from Joel Pomerantz. Another regional resource worth checking out is the Watching Our Watersheds – interactive mapping from the Santa Clara Valley Water District, which provides a good example of online interactive water tools using Google Earth. Check it out and download the data at the link.
I’d be remiss without touching on some of the cool historical map sources, including a few gleaned from the Guide to San Francisco Bay Area Creeks page, including this interactive map from the 1860s
San Francisco c. 1860 – click to open in new tabTopographic map from the 1890s with original creeks in blue, marshes in green, and modern land fill in pink
More to come as I’ve barely scratched the surface on SF Bay area and have not fully looked at historical sources other than those mentioned elsewhere. This may be due to the amount of info available rivals most cities. Kudos to the people at working in this region for providing inspiration and great precedents for work to apply elsewhere.
And if you haven’t yet, read the first of this series – Lost Creeks of the Bay Area – Part I to learn about the groups working in hidden hydrology, art, and urban exploration.
There are a number of cities with a vibrant mix of activities around hidden hydrology, some of which have been covered previously (see Resources). The stories of San Francisco’s hidden hydrology have existed for years, starting perhaps with an account by William Crittenden Sharpsteen of Vanished Waters from 1941, and continuing today with ways to offer hints to the current configuration of odd topographic features like ‘The Wiggle’. There are also references to discovering and possiblydaylightingurban streams in San Francisco, even positing what other cities can learn from their relationship with it’s urban creeks.
Burnham’s Islais Creek Park – via SPUR
One of my favorite organizations, SPUR, has an article from 2006 in their archives ‘Of Buried Creeks and Thwarted Plans‘ worth reading, which explores Burnham’s unrealized 1905 Plan for San Francisco which would have created open space in favor of freeways. “Perhaps one of the most remarkable features of the unrealized Burnham Plan would have made Islais Creek the central natural feature of a long linear park stretching from the upper reaches of Glen Canyon all the way to the bay; today the water runs in culverts buried under the bleak interstate freeway, one of the few that overcame citizens’ opposition in the 1950s and ’60s.” Across the Bay the situation is similar, with references to hidden waters of Temescal Creek and it’s potential daylighting, as well as similar efforts in Berkeley to daylight urban creeks.
The San Francisco Bay Area has a number of interesting projects and resources worthy of investigation and emulation, spanning from mapping, artistic interventions, and historical ecology, warranting a couple of posts to capture in total. Here’s a few of them.
Seep Cityis a project of the local Joel Pomerantz“a writer and natural history educator recognized for his work in waterway research, local journalism, public art and community service”, who also focuses on local urban explorations through the group THINKWALKS. The Seep City was funded by a Kickstarter from early 2015, and is squarely related to the hidden hydrology, as explained on the site. “When San Francisco was first becoming a city, it had many more waterways than now. Those were wet years. When dry years came the gullies became annoyances. People filled in the creeks and low areas with sand, debris and gravel. Marshes and sloughs were filled, too. The edges of the city were expanded into the Bay, making sailable water into salable lots. Today’s rain goes right into sewers, for the most part. Few absorbent soils are still exposed. Remarkably, surface creeks do still flow, here and there. And when you dig, you still find groundwater. If you search you’ll see springs, mostly small, seeping and trickling out onto our landscape.”
“There is now (2010) very strong evidence surfacing that some of the historical assumptions that calculations and details in this article were based on need to be reinterpreted due to further scholarship. Specifically, although many maps show one, it appears that there was never an enduring freshwater lake in the Mission District. It turns out that “manantial” means spring-fed, rather than merely any freshwater. The waterways in the Mission area were all stream-fed, and Anza’s journals make it clear that “laguna de manantial” was a reference to Washerwoman’s Lagoon (earlier called Laguna Pequeña) in what is now the Marina and Cow Hollow areas. Anza passed this on his way to search for a site for the mission and thus included it in the same description. However it was not in the same geographic area.”
The original essay, linked here, shows some more dialogue on this errata. To me, it’s an interesting journey around the continuing evolution of hidden hydrology, that it is often a continual process of refinement and discovery. Some interesting dialogue as well is included on the origins of Phelp’s Lake. and as explained by Pomerantz, “Of course, my discovery creates other layers of mystery.”
The below map depicts the original coastline, marshes and creeks of San Francisco, in the mid 1800s. Lake shapes varied over time, which explains the difference between this and the detailed Mission map in the article.
Ghost Arroyos is a project that got a fair amount of press (Curbed SF, CityLab) emerged from the Market Street Prototyping Festival and the brainchild of Emily Schlickman and Kristina Loring. From the site: “Hayes Creek, a large underground waterway, is still flowing beneath the streets of San Francisco today. We asked passers-by to look behind them – the water spraying from the United Nations Plaza fountain is from Hayes Creek. Beneath their feet, the BART transit authority runs de-watering pumps to keep the tracks from flooding. Even some buildings around the Civic Center still use Hayes water today. To trace the flow of Hayes, they followed the chalked blue lines as they continued down 7th street. In less than a block, they came to where Hayes Creek historically surfaced into a marsh. There they found a watery sonic surprise.” A map below shows the location of Hayes Creek.
From the original project proposal: “Every city has invisible histories embedded within its landscape. Up until the 19th century, ephemeral streams ran through nearly every valley in San Francisco, channeling rainwater to peripheral tidal estuaries. This project, “Ghost Arroyos” seeks to reveal these forgotten waterways of the city through a simple, but powerful intervention. Situated between 7th and 9th street, the project will mark the historical footprint of the arroyos onto the urban surface through paint or lighting. Visitors to the festival will be invited to trace the path of the waterways while listening to a curated recording of hydrological soundscapes and oral histories.” The visual of a painted streetscape was a evocative invitation to the potential to cue people into this lost creek.
The implementation of the project is early, so looking forward to seeing this evolve. A few photos showing a small scale installation of paint on an intersection. A key part of the project is the audio aspects which are available in situ, through boxes mounted adjacent to the ‘painted’ streets. There’s even a step-by-step breakdown of how to make the speakers via Instructables.
The audio is found here on their site:
San Francisco Estuary Institutehas long been a key resource in the region, providing “…scientific support and tools for decision-making and communication through collaborative efforts. We provide independent science to assess and improve the health of the waters, wetlands, wildlife and landscapes of San Francisco Bay, the California Delta and beyond. SFEI’s 50 scientists and experts provide data, technology and tools that empower government, civic and business leaders to create cost-effective solutions for complex environmental issues–from cleaner water and sustainable communities to climate change. We have three primary programs: Clean Water, Resilient Landscapes, and Environmental Informatics.”
My main interest related to the connection between hidden hydrology and historical ecology, which can be defined as synthesizing “…diverse historical records to learn how habitats were distributed and ecological functions were maintained within the native California landscape. Understanding how streams, wetlands, and woodlands were organized along physical gradients helps scientists and managers develop new strategies for more integrated and functional landscape management.” It goes further to explain that “Researchers are increasingly recognizing that restoration and conservation strategies have often been misguided (and unsuccessful) because of a lack of understanding of historical conditions (e.g. Hamilton 1997, Kondolf et al. 2001, Foster and Motzkin 2003, Merritts and Walter 2008). This is particularly true in California, where our cultural memory is short and we have tended to impose concepts appropriate to more humid regions to our Mediterranean and semiarid landscapes (which will become only more so).”
An indicative study comes from the Alameda Creek Historical Ecology Study from 2013, which assesses: “watershed conditions prior to significant Euro-American modification, as a basis for understanding subsequent changes in watershed structure and function, and potential options for future environmental management.” While the mapping involves a cast of many, Robin Grossinger, director of the Resilient Landscapes Project is wellknownfor historic ecology in the bay area, and has written extensively on this, including many articles in SF Bay area.
Aside from reports, there are examples of online resources and studies, such as The Historical Ecology of Miller Creek, which was “…designed to inform residents of the watershed and other interested people about past and present ecological landscapes within the watershed, and how this information might be used to plan for the future. The time frame begins with indigenous land use practices and considers the effects of Euro-American settlement beginning about 200 years ago, continues through the present, and briefly examines the future needs of the watershed. This description is meant to broaden the view of what Miller Creek Watershed could become through science-based planning and careful management. Human induced changes in land use have affected the natural functions and habitats of the Miller Creek watershed. The emerging story foresees ongoing change that would benefit from a comprehensive understanding of the watershed’s history while planning to define and secure essential watershed services for the future.”
OTHER PROJECTS
There are also a number of other urban explorations and art installations worthy of mentioning in brief. These precedents offer some interesting examples of engaging larger communities with hidden rivers and creeks, through bike tours of sewers and regular walking tours of hidden waters.
Some specific examples are summarized below:
One I spotted a few years ago were an interesting series of “tours” that are part geographic and part performance art. Led by artist Chris Sollars, as part of the project Water Shed, which was conducted during Southern Exposure’s Off Shore from 2014, participants walked Islais Creek, Mission Creek, and Yosemite Creek in San Francisco. A summary: ““Tracing the hidden path of Islais Creek, Chris Sollars leads a walk from source to Bay while carrying a rope that references the length of one city block. Beginning in Glen Park Canyon, the group will journey through downtown Glen Park, the Alemany Farm, Alemany Flea Market, a Google bus parking lot and the Southeast Treatment Plant. Stopping at various points along the way, the walk ends in Islais Creek Park to enjoy food and drink gathered along the route. There, participants will be ferried onto and off of Water Shed, a floating shed-like structure.”
There are videos of the walks as well linked from Sollars’ Vimeo site – check one for Yosemite Creek out here.
Across the Bay in Oakland, a project called ‘Creeks Beneath your Feet’ connects residents with hidden hydrology. “Former creeks, now buried in culverts, are memorialized by a series of bronze relief sculptures embedded into sidewalks at locations above these culverts. The pieces portray stepping stones surrounded by native fauna that inhabit the creeks such as Rainbow Trout, Pacific Chorus Frogs, California Newts and dragonflies. Each site features five bronze “stepping stones” inviting the visitor to step across as if crossing a creek.” An article in the East Bay Times provides more info and images, and a map of the locations is found here.
An art installation from Kevin O’Connor from 2012 called “Intimate Strangers: A Ritual for the Buried Creeks of San Francisco” uses hidden creeks as artistic inspiration: “Adding yet another layer to the mystery, massive surges of groundwater, much of it potable, travel continuously just beneath us from related “subartesian” sources that even historically never came fully to the surface. We easily overlook these “creeks” since they have never come into view to receive formal names. My proposal is to place 10 blues pools in a line along the creek bed that runs through Garfield Square. Each pool will be filled with water that I have collected from the buried creeks of San Francisco. The backyard wading pools remind us that there are buried creeks that hold water in many backyard homes in the Mission area.”
Finally, it’s a minor addition, but one map from Rebecca Solnit’s excellent ‘Infinite City: A San Francisco Atlas’ shows the fragment of hidden hydrology in San Francisco. From a review in High Country News: “Third Street Phantom Coast,” for example, is a map of the peninsula’s eastern fringe that depicts a now-forgotten city of ancient shell middens, long-buried streams and concretized serpentine outcrops. It shows how, over the last 150 years, the city’s waterfront expanded as successive layers of landfill were dumped on the tidelands of the Bay. Vanished landmarks from the late 19th and early 20th centuries — the “Tubbs Cordage Company” and the “Site of rancho bear and bull fights,” among others — haunt the rendering.”
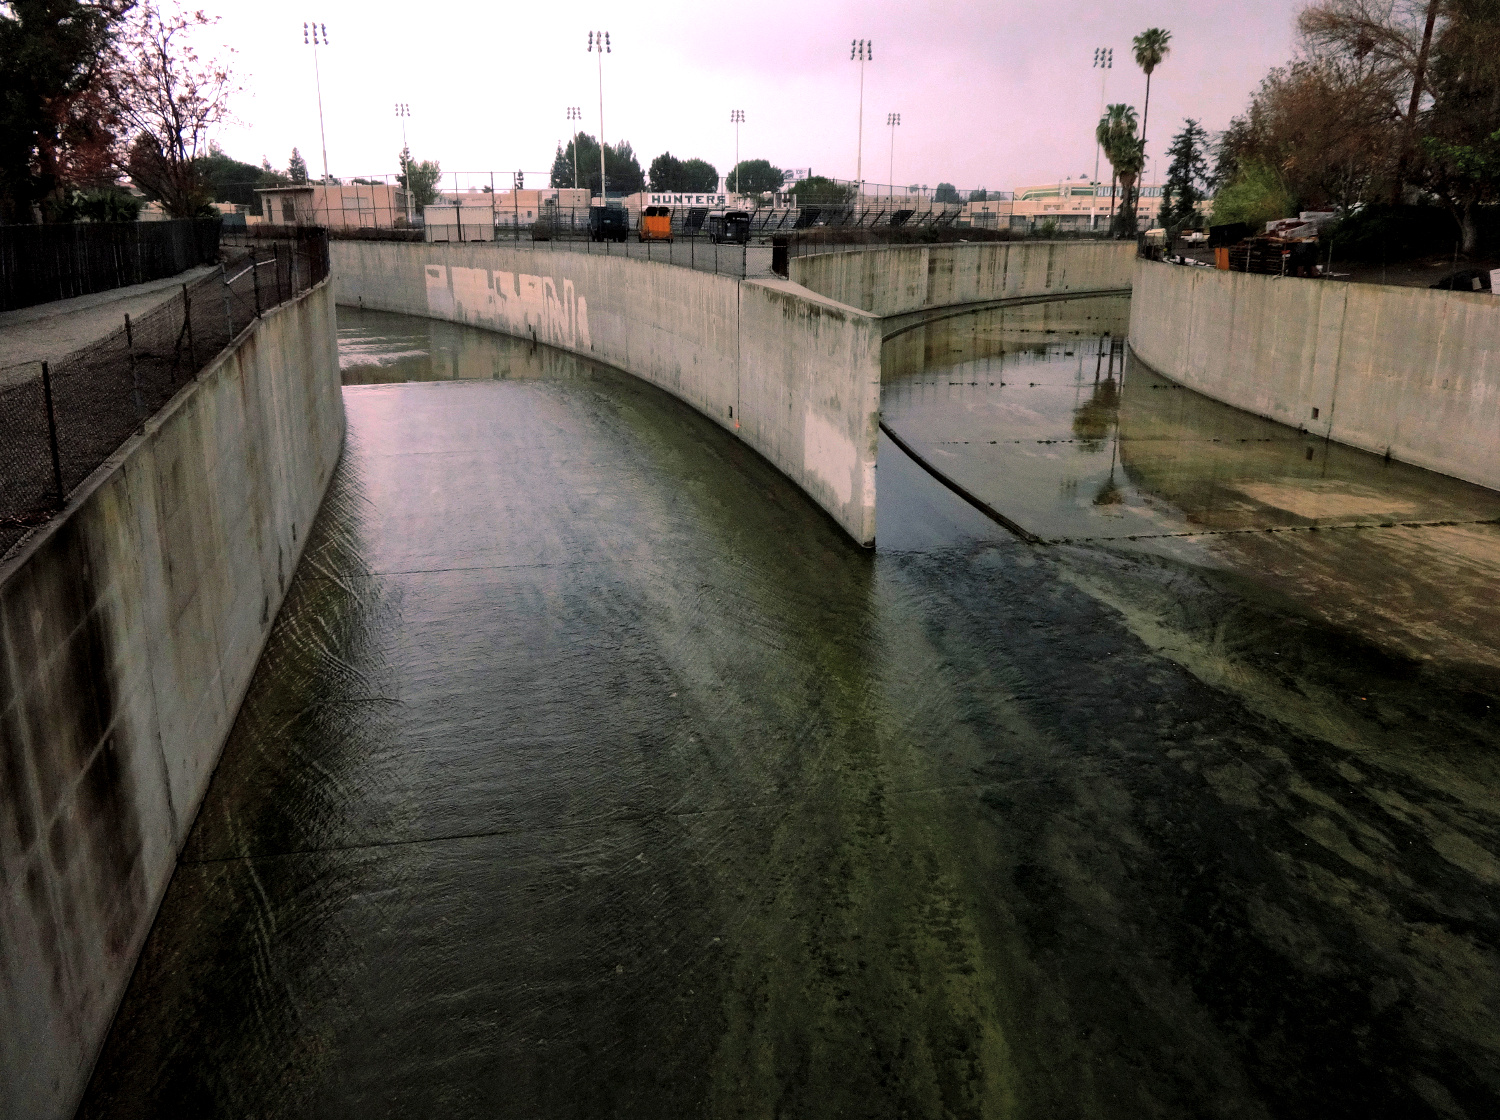
The typical news story from Los Angeles that often emerges concerning rivers tends to focus on the LA River and it’s future and fate. Countless stories of the latest master plans or rehabilitation efforts, Army Corps efforts, or just plain ire at the fact that Frank Gehry was involved have been flying around for years. One of my favorite takes is documented in the fantastic 2008 publication ‘The Infrastructural City‘, which breaks down LA into a number of systems including a good amount of focus on the River. And while no one would dispute the importance of the river to the city (and to countless movie chase scenes) there is a broad and complex hydrology and at work in the City of Los Angeles.
The folks at LA Creak Freak offer a slightly different and broader take, and while they do offer plenty of discussion on the LA River, they explore some of the other tangents of hidden hydrology. As mentioned in their About summary the site is both “… a way to share information about LA’s historical ecology – the rivers and streams that were once here – and to update people on relevant watery news and events with a mostly local focus…” and “…that we believe our rivers and creeks are vital to our communities and our planet. Though degraded and forgotten, they’re worth saving.” This information and activism role is similar in nature to much of my inspirations, so it was interesting to dig into their site. The main players are landscape architect Jessica Hall and Joe Linton, an artist, author and activist with a long involvement in the community. The site links to maps, stories, resources, and some transcribed interviews as well. It’s somewhat free-form, with a few helpful summaries like ‘getting started‘ and ‘recommendations‘ but like many sites, is chock full of place specific info that you just have to spend time digging in to.
Some of the links led to a map from the Rumsey collection of the topography of Los Angeles from 1880 by William Hammond Hall shows another “Beautiful hand drawn map of the Los Angles-San Bernardino Basin. Pen-and-ink and pencil. Relief shown by hachures. It appears to be a base map on a scale of two miles to an inch, probably preliminary (several of Hall’s notations on the edges indicate corrections needed to the topography) and earlier than the 1888 Report titled “Irrigation in California” that had 15 maps that may have been derived from this map. It may also have served as the base for “Drainage area map to accompany report on irrigation and water supply in California” by Wm. Ham. Hall, State Engineer. (188-?). Hall was a famous engineer who was the first state engineer and was responsible for many of the early state water projects (see California Water Atlas). This map does not have any names drawn in except for a few towns, rivers, or railroads lightly penciled in. All the land divisions and city plats are indicated, with mountains, rivers, railroads, roads, arroyos and shorelines shown.”
A link to a map of the North Branch of the Arroyo Seco offers some commentary on the mapping: “I am fascinated by the messiness of the historical landscape before it was flattened and filled, with water confined to neatly linear paths. There are so many notations mapmakers used to depict the ways water manifested in the historical landscape. William Hammond Hall’s maps go beyond mere notation, into the realm of artistic representation. In contrast, USGS maps of contemporary Los Angeles use a limited and inflexible set of icons to depict water: blue lines for waterways (thin or thick, solid or dashed), and blue amoebas for lakes. Does the simplicity of these icons reflect what we’ve done to our surface water; or has what we’ve done to our surface water reflect our simplistic cultural idea about how a water body is supposed to look like and behave?”
While the USGS maps of modern day (or at least 1975 from above) may have evolved be more more generic, but the old ones had some beauty, as shown here in a map from 1896 snapped from the great USGS Historical Topographic Map Explorer.
I love the scale of the monumentally awesome Historical Creek & Wetlands Map of the lower Lost Angeles River and environs map below shows a range of buried creeks, sandy washes, historic wetlands, as well as existing creeks, concrete channels and drains (key to left) from around 1902. Not sure who was the author of this map although the copyright shows 2003 from North East Trees. The original orientation of the LA River and tributaries is interesting to see, along with the other hydrologic elements and topography. There are a number of other excerpt maps from areas around LA as well.
Obviously the LA River is the major drainage, but there are plenty of tributaries and other side drainage weaving through the urban realm. A Google map created by the LA Creek Freak folks provides a bit more context beyond the main LA River channel, showing historic drainages woven through the City such as Ballona Creek much of which is buried and/or channelized.
A side trip to Jane Tsong’s Myriad Unnamed Streams is a worthy diversion, with stories and maps focusing on Northeast Los Angeles. Various snippets of water history like “Where the Creeks Ran Underground” offer some place specific notes, maps and history for a small segment of LA around Eagle Rock Creek. This series of key maps shows the area with streams only.
And with the overlay with modern sewer system, “Street map showing storm drains/1888 water courses as mapped by State Engineer William Hammond Hall, overlaid onto modern topographical data. Street, stormdrain and topographical data: Bureau of Engineering.”
And from 1931, “The then-new Fourth Street Bridge” showing a natural river bed and although channelized, softer edges to the river.
This one, from 1938, indicates the plans for channelization: “Shown is an artist’s sketch which graphically portrays the system of dams, underground storage basins, etc., that were set up by the Los Angeles County engineers to prevent floods and to conserve hitherto wasted rain water for domestic purposes.”
The end came after floods in spring of 1938, as described in a book The Los Angeles River: Its Life, Death, and Possible Rebirth: (Blake Gumprecht, 2001): “The first Los Angeles River projects paid for by the federal government and built under the direction of the U.S. Army Corps of Engineers were completed a few months after the flood. Work was finished in October 1938 on three projects to lower the river’s bed twenty feet, widen its channel and pave its banks for a little over four miles upstream from Elysian Park. Three months later, construction was completed on the first segment of what would eventually be a continuous trapezoidal concrete channel to carry the river from Elysian Park to Long Beach.”
One of the most amazing resources I’ve discovered was the website Philly H20. A comprehensive look at creeks and sewers in Philadelphia, don’t let the charmingly anachronistic website style put you off, as the amazing detail and density of info contained therein. The site is done by Adam Levine, the “the local expert on the history of Philadelphia’s rivers, streams, and drainage systems.” A quick into from the site:
It has been my pleasurable challenge, as a consultant to the Philadelphia Water Department (PWD) since 1998, to try to piece together the fascinating history of the city’s many lost streams. PWD has preserved its own collection of historical material, which is a rich source of information, and I have supplemented that base with research in local libraries, historical societies, archives and relevant departments of the city government.
Besides many useful written records, I have uncovered a wide range of graphic material including paintings and drawings, maps and plans, photographs and surveys. This material stretches across the breadth of the city’s long history, since changes were made in the landscape almost as soon as William Penn began building his new city along the Delaware River in 1682. The bottom line is that, over the course of several centuries, most of the city’s surface streams have been channeled underground and incorporated into the city’s 3,000 mile sewer system.
The section From Creek to Sewer provides a bit more explanation, “As in many urban areas, most of Philadelphia’s surface streams, encompassing many square miles of watershed, were systematically obliterated over the course of the city’s development. Diverted into pipes–their valleys leveled with millions of yards of fill and overlaid with a grid of streets–these streams now flow in some of the largest sewers in the city’s 3,000-mile drainage system. In most cases, these projects were designed as combined sewers, carrying raw sewage along with the stream flow and stormwater runoff.”
A sequence of “Historic and modern stream maps created by the Philadelphia Water Department (using data gathered from a variety of sources), to educate the public about the fate of many of the city’s streams.” The first shows the historic streams, not sure of a date but according to the site probably from around the 1700s or prior to significant permanent settlement.
The current maps shows some intact watersheds in outlying zones, but most of the inner core, North Philadelphia with the exception of Tacony and Frankford Creeks, and mostly gone in South and West Philadelphia areas buried.
The overall landscape change is best represented with the composite map with subsurface piping shown in red, highlighting the underground hydrology still at work, but really emphasizing the removal of most of the creeks and streams in the core and replacement of a much more structured system. This is a pretty common map echoed many times around the world through the 1850s to early 1900s.
Levine has linked a number of interesting maps, such as the early sewerage system from 1895 which already shows the manipulation of streams and construction of diversions along with buried creeks. It also shows that the city was using a combination of sewer and combined systems, which was again used in many cities as a cost-effective strategy. I’m struck now just how Levine curates the material, but offers a historical explanation, on the page From Creek to Sewer, of how and why these waterways were degraded and eventually filled. A short excerpt:
“Since it was then standard sewage disposal practice to direct branch sewers downhill into the nearest stream, they knew that even pristine surface streams would become polluted once the areas around them were developed. Culverting the streams before they became polluted was seen as a positive step to protect the public health. In undertaking these projects, the engineers also hoped to reduce the cost of the city’s infrastructure in a number of ways. Sewage, being mostly liquid, flows most cheaply by gravity–pumping it up a slope is expensive in terms of fuel costs, and is only as reliable as the pumping equipment. By placing sewers in the natural stream valleys, the engineers got the gravity flow they needed, and in the process they managed to avoid the high cost of making extensive, deep excavations. Once the valleys were filled in over the newly built pipes–in some stream valleys in Philadelphia, more than 40 feet of fill was used–the cost of building a bridge each time a main street crossed the stream was avoided as well. “
There’s links to even more map sources as well, including the Greater Philadelphia GeoHistory Network, maps and photos at PhillyHistory.org and digitizd maps available as well as the Pennsylvania Spatial Data Access (PASDA) site. Another huge archive of info is curated a the Places in Time: Historical Documentation of Place in Greater Philadelphia site, which one, especially if you’re purview is Philadelphia, could spend a lifetime digging through. These 1890 Noll maps (below) are great, and Levine mentions some of the qualitative reasons. “This particular map interests me because it shows the many creeks that other maps of the period omitted even before the creeks were actually obliterated. I also appreciate the elevation contour lines, and although the datum used is different by several feet from the current datum, the numbers still give a sense of the rise and fall of the terrain. The street grid also seems more realistic than other depictions, in that it ends at the creek valleys and indicates, with dotted lines, a few streets that have been projected but not built.”
One of my favorites was the photograph of this physical topographic model from the 1940s “… which clearly shows the transition from the flatter terrain of the Coastal Plain to the hillier terrain of the Piedmont.”
HISTORICAL GIS
One hidden gem was a report from the USGS Fact Sheet FS–117–00 from October, 2000 on “Mapping Buried Stream Valleys in Philadelphia, Pennsylvania” that outlines a process for mapping streams to identify potential risk zones for subsidence. From the introduction: “Specifically requested were a preliminary evaluation of geologic factors that control recent ground subsidence in the Wissinoming neighborhood (fig. 1) and recommendations for more comprehensive geologic studies that will be required to design a remediation effort and to delineate other neighborhoods that are potentially at risk.”
The use of historical maps of the stream valleys, specifically 1899 USGS topographic maps generated landscape change diagram. From the report: “Examples from the topographic change map included in USGS Open-File Report 00–224. Areas shaded in yellow and labeled Po have been characterized as possible fill. Areas shaded in red and labeled Pr have been characterized as probable fill. A, Map segment showing historical stream valleys of Wissinoming Creek and Little Tacony Creek. B, Map segment showing historical stream valley of Wingohocking Creek.”
The Philly H20 site is impressive in scope, and it’s clear the passion for history, hydrology, and place that are embedded within. Those in the Philadelphia area interested, this should be the first stop – as much of the legwork required in other cities has been done here. There’s tons more info on this site and the more you dig the more info you find, like an Archive with more exhaustive links to many more historical sources and write-ups of key creeks. One by Levine I perused was this “Frankford Creek Watershed: A historical overview of the Philadelphia section” that had one of the most interesting graphics telling taglines: “A Snake that will be Straighted Out”, indicative of the conversion of streams at the time.
ENDNOTE
Finally, I’d be remiss if I didn’t mention one of the most incredible Philadelphia projects, from the early 1990s. The brainchild of Anne Whiston Spirn when she was at Penn and later through MIT, the West Philadelphia Landscape Project had a “…mission is to restore nature and rebuild community through strategic design, planning, and education projects.” Over the course of 25 years this project provided a unique model for community engagement and urban ecosystem restoration that has permeated others work since.
A focus of the work is Mill Creek, where the project sought “…to demonstrate how to create human settlements that are healthier, economical to build and maintain, more resilient, more beautiful, and more just.” The focused Mill Creek Project investigated hydrology and history with an aim to “…explore how a new curriculum organized around “The Urban Watershed” could combine learning, community development, and water resource management.”
This was some of the first examples of GIS based historical mapping I had seen, and although the tech was early, the impact on me was long-lasting. This is perhaps my first exposure to the concept of historical mapping and urban streams, and I vividly remember reading about it in undergrad and being blow away. I mention it just in passing as a Philly endnote (because it deserves a more complete review as a case study) in greater detail. More on this work to come!
I had the opportunity to see Kate Orff from SCAPE speak a few weeks back at University of Washington, and it was inspiring to see the mix of project work and activism that is the mark of this creative firm. This project aligns nicely as it is featured in her new book, Toward an Urban Ecology and is another example of ecological design in an urban context. She focused on some of the older projects in her talk, but this is one I’ve been waiting to explore here at Hidden Hydrology, the Town Branch Commons in Lexington, Kentucky.
The project unique example of using the historical hydrology and geology as design inspiration – not a true daylighting but falling somewhere in the middle of the continuum from art to restoration. From Architect’s Newspaper, a recent post SCAPE turns Lexington, Kentucky’s long-buried water into an asset provides a pretty extensive visual overview and some description into the project that complements the overview in the book.
“Town Branch Commons weaves a linear network of public space along the 2.5 mile path of the historic Town Branch creek in downtown Lexington, Kentucky. Once a waste canal, sewer, and water conduit for the city, the buried stream channel of Town Branch is an opportunity to reconnect the city with its Bluegrass identity and build a legacy public space network for the 21st century. Rather than introducing a single daylit stream channel into the city fabric, the design uses the local limestone (karst) geology as inspiration for a series of pools, pockets, water windows, and stream channels that brings water into the public realm.”
The renderings show the movement of water and the use of stone to embody the conceptual ideas of the Karst geology, which is responsible for the landscape of disappearing and reappearing springs. A more expansive overview of the landscape type from the International Association of Hydrogeologists (IAH) site describes it as: “A landscape formed by the erosion of bedrock, characterized by sinkholes, caves, and underground drainage systems. Many of the surface features are due to underground processes of the weak acids of groundwater dissolving the rock and creating a varied topography.”
This is seen in the design concepts for the spaces that are woven through the corridor, an approach referenced in Toward an Urban Ecology as a ‘Geology as Materiality’ (p.38). The Karst metaphor is incorporated with orderly frames, referencing with geology within a semi-formal urban context that softens the spaces while maintaining functionality. This is where the design-centric approach would differ from the more formal restoration, referencing a key hydro-geological precedent in an urban context. As mentioned in the book ‘Towards an Urban Ecology’: “Town Branch is recast as hybrid hydrological and urban infrastructure, creating defined and safe spaces for water, pedestrians, bicyclists, and vehicles along its path. In the downtown core, streets are realigned to make way for an extended public realm, where water is expressed not at the surface, but underground, as rainwater-fed filtration gardens clean the waters of Town Branch before entering the culvert below.” (p.36)
The concept of the sunken areas allow for an immersive experience within an urban realm. The separation of grade and edges of formal and natural provide variety of experiences that provide a model for ‘daylighting’ and applied urban ecology that is both functional and artistic, aesthetic but with some ecological rigor. As mentioned in A/N:“To create freshwater pools—SCAPE calls them “karst windows,” in reference to similar naturally occurring formations—the design will tap old culverts (essentially large pipes) that previously kept Lexington’s karst water out of sight.“
And more dramatically enveloping in a recreation of the Karst geology and incorporation of moving, dynamic water, while also allowing for physical access to the water, a rare treat in urban areas. This image shows waterfalls near Rupp Arena, a high-visibility area adjacent to more formal plaza spaces at surface.
The nature/culture connection is strong, and a unique model that is about the landscape of Lexington. As mentioned in A/N: “Here it’s all about finding a unique identity framed around a cultural and geological history of a place,” said Gena Wirth, SCAPE design principal. “What’s replicable is the multipurpose infrastructure that unites the city, its story, and its systems.”
Water Walks
An interesting part of the narrative is not just the project design, but the generative strategy used by SCAPE to develop the project. Those already familiar with another SCAPE project, the fantastic Safari 7, (which will get some documentation here soon) will note some similarities of the use of place-based audio and mapping, They documented a public outreach process Town Branch Water Walk which aimed to connect residents to the local landscape. From their site:
“The result, Town Branch Water Walk, is a self-guided tour of downtown Lexington’s formerly hidden water body, Town Branch Creek, with content developed together with University of Kentucky students. The design intervention is not a physical landscape, but a communication tool– using podcasts, maps, and walks for the interpretation of urban systems. The Water Walk gives a broad understanding of the biophysical area around the Town Branch, reveals the invisible waters that run beneath the city, and demonstrates some of the impacts each resident of Lexington can have on the river and its water quality. By sharing how water systems and people are interrelated—both locally and globally—the Town Branch Water Walk makes stormwater quality relevant, linking it with the history, culture, and ecology of the city.”
The walking tour is accompanied by audio that can be used in situ as podcasts, and as more formal walking or bike tours – and this model/map was also used at events along to provide listening stations for the various stories.
There’s more on this process worthy of additional exploration and future posts, and check out the audio and links at www.townbranchwaterwalk.com
The work of David Ramos and his work on the site Imaginary Terrain that includes mapping, tours, and investigations of the hidden rivers of Washington DC. He comes at the task from the lens of designer, developer, and design educator and mentions: “I’m interested in how long-buried natural systems and historic land use patterns poke their way to the surface, shaping our cities today. I produce maps and lead tours that examine landscape history and planning issues, particularly in the D.C. area.” This is the point of departure for his work mapping the historic and modern of DC.
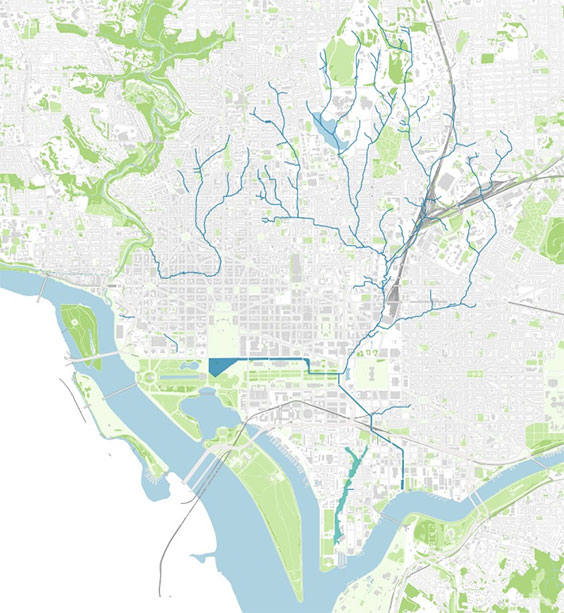
Some earlier maps show the evolution from the mapping of the creeks on the historical map and the modern street network.
As mentioned, the bulk of historical mapping data is derived from the Topographical map of the District of Columbia / surveyed in the years 1856 ’57 ’58 & ’59 by Albert Boschke which was published in 1861. It shows the plan for Washington DC as well as extensive outlying areas.
This followed the 1857 publication by of the Map of Washington City, District of Columbia, seat of the federal government: respectfully dedicated to the Senate and the House of Representatives of the United States of North America which was a more zoomed in version showing structures of the formal city.
These maps are both available via the Library of Congress, which also offers an interesting origin story:
“With the outbreak of hostilities in April 1861, it became necessary to begin preparing the defenses of Washington, DC. In 1857, Albert Boschke, a German born civil engineer, published his Map of Washington City, District of Columbia, seat of the federal government: respectfully dedicated to the Senate and the House of Representatives of the United States of North America which showed, for the first time, the location of every structure in the city as of the publication date. Following the publication of the 1857 map, Boschke and his surveyors continued surveying the entire District of Columbia, sometimes referred to as the ‘ten mile square’, which resulted in his landmark Topographical map of the District of Columbia / surveyed in the years 1856 ’57 ’58 & ’59. Published in 1861, near the outbreak of the war, this very detailed map showing the locations of all the structures in the city was a potential threat to the security of the entire city, the seat of the federal government. According to an 1894 article by Marcus Baker in the National Geographic Magazine, Boschke sold his interest in the map to the publisher, David McClelland. Shortly after publication, representatives from the War Department seized the original manuscript and copper plates from which the map was published to prevent dissemination of the map.”
“This paper traces the disappearance or reduction of the many prominent springs and waterways that existed in Washington, D.C. , 200 years ago. The best known springs were the Smith Springs (now under the McMillan Reservoir), the Franklin Park Springs (13th and I Streets, NW.), Gibson ‘s Spring (15th and E Streets, NE.), Caffrey ‘s Spring (Ninth and F Streets, NW.), and the City Spring (C Street between Four and One-Half and Sixth Streets, NW.). Tiber Creek, flowing south to the Capitol and thence westward along Consititution Avenue, joined the Potomac River at 17th Street and Constitution Avenue. In the 1800’s, the Constitution Avenue reach was made into a canal which was used by scows and steamboats up to about 1850. The canal was changed into a covered sewer in the 1870’s, and the only remaining visible surface remnant is the lock-keeper ‘s little stone house at 17th and Constitution Avenue, NW. Because of sedimentation problems and reclamation projects, Rock Creek, the Potomac River , and the Anacostia River are considerably narrower and shallower today than they were in colonial times. For example, the mouth of Rock Creek at one time was a wide, busy ship harbor , which Georgetown used for an extensive foreign trade, and the Potomac River shore originally extended to 17th and Constitution Avenue, NW. (Woodard-USGS)”
The fact that this document was produced by the USGS I am curious what the motivation was, beyond mere historical interest. There is some reference to sedimentation in current creeks, due to development, and the cost of dredging to maintain navigability. Perhaps worthy of a follow-up post. Finally, I did find this interesting MLA Thesis from Virginia Tech student Curtis A. Millay, worth checking out: Restoring the Lost Rivers of Washington: Can a city’s hydrologic past inform its future?
The main question is interesting, and offers potential for how study of historic hydrology can inform future development.
“Can a historically-driven investigation of these buried channels lend credence to the resurrection in some form of a network of surface stormwater channels, separate from the municipal sewage system, to solve the city’s sewage overflow crisis? The following study is an initial exploration of the re-establishment of waterways through Washington with the purpose of improving the current storm sewer overflow dilemma and exploring the potential urban amenities that they could provide as part of a stormwater management plan for the year 2110.”
Many precedents and projects from the around the globe, being slowly populated in the Resources section. These will all get some more in-depth attention, and starting it off locally, I wanted to highlight The Waterlines Project. The ability to ‘Discover and Explore Seattle’s Past Landscapes’ is hosted by the Burke Museum of Natural History and Culture, and offers a densely researched and vibrant picture of the historic cultural and ecology of Seattle prior to the significant engineering that has subsequently taken place.
“Founded on Indian ground by American settlers in 1851, Seattle is one of the most dramatically engineered cities in the United States. Its shorelines have been extended, lagoons filled, hills flattened and rivers re-routed. Built on an active geological fault near a large volcano, Seattle has also been jolted by huge earthquakes, washed by tsunamis, covered by volcanic mud and ash, fluted by glaciers and edged by rising seas.”
The project is historical in nature, using the shorelines as a datum for use and reconfiguration over time, which the creators offer as”an appropriate and compelling framework for viewing the city’s history–one that will engage public audiences and raise themes that are important in American history.” Synthesis of documentary info (maps, photos) alongside oral histories and other archaeological and geological study weaves a mosaic visual that is more accessible to the public.
The main product of the project is the large Waterlines Project Map, which available in a number of places around Seattle, as well as graphic and PDF download on the site. The front illustrates the mid-19th Century landscape, before settlement by non-native peoples, including keyed places that reference Coast Salish terms, many of which are evocative and descriptive of function, such as The Growing Place and Water Falling Over an Edge. The ecology is also evident, with a range of forest, prairie, wetland, rivers and creeks.
There’s also a very faint outline of the modern shoreline, which doesn’t dominate but gives a feel for the adjustment of these Waterlines the significant filling, straightening, and flattening that occurred. This is highly evident in the mouth of the Duwamish River seen below, with the creation of Harbor Island and industrial lands south of downtown, as well as the channelization of the previously bendy river.
The back side of the map shows more information in the form of tours of significant historical stories, such as the lakes, glaciation, and rivers, as well as the original settlement location in current Pioneer Square, which was also an indigenous village named The Crossing Over Place. There’s also a timeline of the most recent 20,000 years of geology and development for a bit of long context.
The background for the map is immense, drawing from the previous work of the the Puget Sound River History Project, and involves multiple disciplines. yet it’s simple and effective, somewhat similar to the Mannahatta 2D visuals. The site offers additional source materials, such as maps, photographs and links to resources. Some interesting juxtaposition occurs when paired with recent aerial photos at similar scale – both as a way to emphasis erasure and addition, but also to show traces of what still remains.
The iterations of time between the two time intervals above are indicative of the Seattle penchant for ‘making land’ (matched in intensity with ‘taking land’ perhaps). The story of the filling of the Duwamish and colonization of tideflats and water from 1875 through 2008 in the series below and reinforces the significant alteration that both radically shifted the ecology of Seattles only river, but also provided land to grow the city and industrial base.
The core team includes Peter Lape, Amir Sheikh, and Donald Fels, and a host of collaborators listed here. While referential, the focus is not on the buried streams and creeks, so my work is complementary and draws much in terms of inspiration and information from this project as well as possible collaborations and resources in Seattle.
For a bit more context surrounding the Little Crossing Over Place, this video made by the team shows the transformation of the Pioneer Square area of Seattle “a bird’s eye glimpse at some of the social, economic, and landscape histories of the neighborhood through time.”

 We live in an age where the impacts of climate change are seen daily. Data on global and local conditions is vital to our further understanding of adaptability and resilience both as protection from storms as well as mitigating longer term impacts. While understanding where we’re at in modern times is essential, comparing that to historical reference conditions connects threads from past to present and enlivens this discussion. Thus in the spirit of hidden hydrology and linkage to climate and rainfall, I was fascinated to learn about the book Climatology of the United States, And of the Temperate Latitudes of the North American Continent, authored by Lorin Blodget in 1857. This is interesting as it coincides with much of the development of Pacific Northwest cities in the mid 1850s so is a good indication of some predevelopment metrics, but more importantly is towards the beginning of the global Industrial Revolution (centered in London and radiating outwards), which led to rapid increase in development of industrial infrastructure and processes that created significant amounts of atmospheric CO2, which is arguably one of the biggest contributors to climate change.


 The previously mentioned San Francisco Estuary Institute, which was responsible for some of the

 There are also


 in interest related to the connection between hidden hydrology and
 There are also a number of other urban explorations and art installations worthy of mentioning in brief. These precedents offer some interesting examples of engaging larger communities with hidden rivers and creeks, through