I was really excited to see the post from Chicago’s Newberry Library yesterday on their Twitter feed, showing them rolling up a long map of the Mississippi River. This 1866 ‘Ribbon Map of the Father of Waters‘ created by Coloney, Fairchild & Co. and published by Gast, Moeller & Co. Lith., and was meant to provide steamship travelers with a way to ‘follow along’ on their journey by highlighting key elements and places along the route.
Ribbon Map of the Father of Waters, by Coloney & Fairchild (St. Louis, 1866). Mounted on original wooden scroll and lined on linen. Courtesy of the American Antiquarian Society, Worcester, Massachusetts. – via Common Place
A quick search finds this writeup on Atlas Obscura, where they mention the unique quality of these maps and how they differ from larger atlases in their linearity of travel. “As Jim Akerman, the Curator of Maps at Chicago’s Newberry Library, points out, the Ribbon Map of the Father of Waters belongs to a class of map with a deep history: the “itinerary” or “strip” map. Unlike network maps, which are designed to show all journeying possibilities—think of a road atlas, or a big fold-out trail guide—strip maps “are organized around a specific route of travel,” he explains. “It’s meant to give you very close guidance.”
” It begins as a barely perceptible stream in the upper left of the image, eventually taking shape as a hand-colored blue line winding its way through ten different states (the boundaries of which are indicated by block letters that parallel the river on either side). Seeing the river in this way conveys the fluctuating nature of the river’s course, from the bulbous expansion of Lake Pepin between Minnesota and Wisconsin to the looping cutoffs below Natchez, Mississippi, and offers a visual contrast between the sparsely populated upper river and the more densely settled lower portion.”
The idea of this linear sequence seems fitting for water journey, but did require making linear a journey that was not uniquely north-south, as mentioned in Common Place: “In the uppermost 470 miles of the Ribbon Map of the Father of Waters—from St. Anthony Falls to the river’s headwaters—the Mississippi flows mostly west to east, though that is not made evident by the consistent linearity of the map (fig. 9). Despite the fact that others had shown this to be quite a watery area, only a few patches and lines of blue disrupt the relatively vacant space of the map. “
In the end, it was interest to hear that it was perhaps mostly as a, portable way to deal with annoying passengers, as mentioned in Atlas Obscura, quoting Luarca-Shoaf ““The river was a source of great awe,” she says. “That kind of length, that kind of spaciousness was incomprehensible to a lot of folks who were coming from the East Coast.” An advertisement for the ribbon map suggests that people needed an outlet for that awe: having your own chart to unroll, it promised, would stop you from “constant[ly] questioning… the officers of the boat,” and causing “an immensity of annoyance” to them.”
via Atlas Obscura
It’s interesting to think of similar scenarios today in which this would work, which riff off of a linear travel route (mass transit, trains, boats), both in terms of making new versions of analog maps, but also infusing things like GPS enabled digital technologies. We all like to follow-along on a route, and there’s probably a bevy of operators of transportation looking for ways to entertain travelers and stop them asking ‘where are we’?. However, it also gives opportunities to enrich the experience by highlighting key points, historical layers, moments in time. This is why it’s compelling.
The snapshot of the map below, showing the reel and cassette, gives a sense for the quirky portability of this. I was tempted to post the entirety of the map as it would be a long post. Perhaps scrolling on a phone is the new reeling? If you’re curious for that, download your own hi-res version here at the Library of Congress.
Detail of title and scroll, Ribbon Map of the Father of Waters by Coloney & Fairchild (1866). Courtesy of the David Rumsey Historic Map Collection. – via Common Place
As the title suggests, there were many incarnations of Chinatowns over the years in Portland focused around two zones. The first is the urban development zone of habitation that shifted shape running along the Willamette River to areas centered on Burnside and running to the north and south. These emerged first as a cohesive enclave, and later into a dispersed ‘non-clave’ that persists somewhat today in the small district of Old Town/Chinatown. The second is a zone of Chinese Vegetable Gardens further upland south of Burnside and west of 14th and provided more informal housing and opportunities for vegetable gardens. My focus here is on the latter, the farming zones inland along the banks of Tanner Creek, which Wong discusses and outlines their evolution over time, and how the fates of Chinese farmers and the creek were linked.
The three vicinities of Chinatown – From Wong, p.206
Much of the backstory here is found in the previous post, which focuses on a 2016 article by Putsata Reang in Oregon Humanities, entitled ‘The Farmers of Tanner Creek’ along with some additional information from Tracy Prince’s book “Portland’s Goose Hollow”. In this case, I was pretty fascinated by the dual narratives of the erasure of the Chinese Vegetable Gardens in tandem with the erasure of Tanner Creek, which is illustrated in the series of maps in Wong’s book, spanning 1879 to 1908.
Via “The Farmers of Tanner Creek” – Oregon Humanities “Tanner Creek runs between Chinese gardens and shanties, circa 1892. Providence Park, the Portland Timbers soccer stadium, now stands where these gardens once did. “
I took the liberty of adding a few items of color to these maps, focusing on the routing of Tanner Creek and the extents of the Portland Chinatown Vegetable Garden Community. As mentioned by Wong the roads “…were needed to serve an expanding population, but the flood-prone Tanner Creek and the gulch that meandered through this area were dominant nature features that controlled much of the building potential of the region.” (211) Thus improvements were required to tame this and create conditions better for development and expansion. Wong continues:
“In 1873, the old wooden bridge that spanned the creek connecting B Street to a small number of residences collapses in the rise water fed by winter rains, necessitating replacement and improvement. In July of that same year, the City of Portland contracted Chinese workers to construct a 115-foot cylindrical brick culvert sixty feet below the level of B Street. The culvert was to run along the bed of the creek, with some infill of the gulch to permit construction of a new bridge. At six feet in diameter, the culvert was large enough for a man to walk through and was intended to provide drainage for at least a hundred years. This improvement made it possible to control, if not totally prevent, flooding of the creek and associated erosion along the creek bed and the embankment up to street level.” (211)
The control of flooding by installation of the pipe of Tanner Creek allowed for the Chinese to occupy the site for gardening, as it no longer flooded. The first map from 1879 (p.210) shows a linear band of gardens along Tanner Creek parallel to B Street (current Burnside Street) which future road rights-of-way extending to connecting streets, but the creek had limited development of these roads, and the margins occupied with “Chinese Shanties”.
Between 1879 and 1889 the amount of area for Vegetable Gardens increased dramatically, from 3 acres to over 21 acres, as shown on the map below (page 214). The reduced flooding allowing for farming and Shanties to expand, filling the entire lowland zone. The new plank road to the east and a new wooden bridge spanned new developments towards Jefferson to the west.
1890s – Trestle bridge, Chinese vegetable gardens, Portland High School Courtesy Oreg. Hist. Soc. Research Lib., bb007389
The Creek was still intact through this zone as well, however starting to get chopped up with development on the edges. The ability of the Chinese to extract maximum production from this space was notable, as Wong mentions: “The immigrant gardeners… acted collectively, sharing the labor and the profits as they continued to farm the low-lying ground and slopes of the Tanner Creek Gulch. The Chinese applied their extraordinary agricultural skills, shared by Cantonese immigrants of rural background, to successfully cultivate the land.” (212)
As seen above, at the time, there was some development, but more residents were moving near here and building larger houses, and for a short time the two lived in close proximity with little issue.. “Perhaps the year-round beauty of the gardens and the convenience of easily available low-cost produce enable two such economically disparate and cultural distinctive social groups to coexist for many years.” (215)
The 1901 map (below, from page 216) shows the impact of a new resident, The Multnomah Amateur Athletic Club (now the current The MAC ), which displaced some of these gardens by moving into 5 acres to the north of the creek, using the natural slope as a viewing amphitheater and building a clubhouse. They also constructed considerable raised plank infrastructure on Alder Street, which eliminated gardens below there (but did keep the creek free flowing for a while longer). Farmers expanded the Shanties in existing areas, and moved to the area west of Jefferson where they installed new gardens and Shanties. The creek it seems to also have started disappearing more in this period. The drawing doesn’t show a key to connote what dashed lines mean versus solid, but it’s probably not a stretch to imply much more culverting of flows, and the plank roads also serving to visually disconnect the creek from views of residents.
By 1908 the map (from page 217) expansion of the city was reducing (to around 11 acres) the area of gardens even more as land became more desirable. The Creek was removed through conversion of bridges and plank roads into surface streets, which filled up gulches. This was a product of one of the “… city’s long-range projects for controlling flooding, raising the grade to accommodate roads, and encouraging urban residential development.” (218) The area near the Multnomah Amateur Athletic Club purchased the land and “over the next few years, both Tanner Creek and the land adjacent to it were filled to permit final construction of the athletic club and nearby homes.” (219)
Together with a number of ordinances aimed at reducing the number of Chinese vendors selling products, and finally just outright banning street peddlers in certain areas. As Wong concludes:
“Portland’s urban growth and expansion into the Tanner Creek area, the filling in of the creek, and the city ordinance that prohibited the rural Chinese from earning a living did irreparable harm to the fragile gardening community. A reporter’s prescient statement in 1889, that the time would likely come when ‘the gulches [would be] filled up and used as building site,’ had come to pass, and the Chinese Vegetable Gardens community disappeared from the record after 1910.” (220)
It’s a wonder as well that it lasted as long as it did, within the rapid urban expansion and the racist undercurrents at the time. The map sequence is a great snapshot in time to see Tanner Creek in the midst of Portland’s urbanization towards the end of the 19th Century. While, it is not totally clear graphically which portions of Tanner Creek were still remaining and which were buried, it shows a valuable sequential picture of the development of this portion of the city and how land shifted from that which had little value to some (and immense value for growing food for others) to becoming more necessary for further development. Gardens and creeks presented barriers to this progress and were slowly eroded and ultimately erased. Wong’s ‘Sweet Cakes, Long Journey‘ is an essential picture for understanding Chinese life and contributions to the history in Portland, of which the above is just one story. However, it is a critical one in terms of hidden hydrology, showing the displacement of Chinatown Vegetable Gardens in tandem with development that slowly buried Tanner Creek, forever losing it’s productivity as a creek and its ability to support agriculture in the city.
HEADER: 1892 Image of Chinese Gardens and Homes in Tanner Creek Gulch, Photo courtesy of Gholston Collection – image via Oregon Humanities, “The Farmers of Tanner Creek“
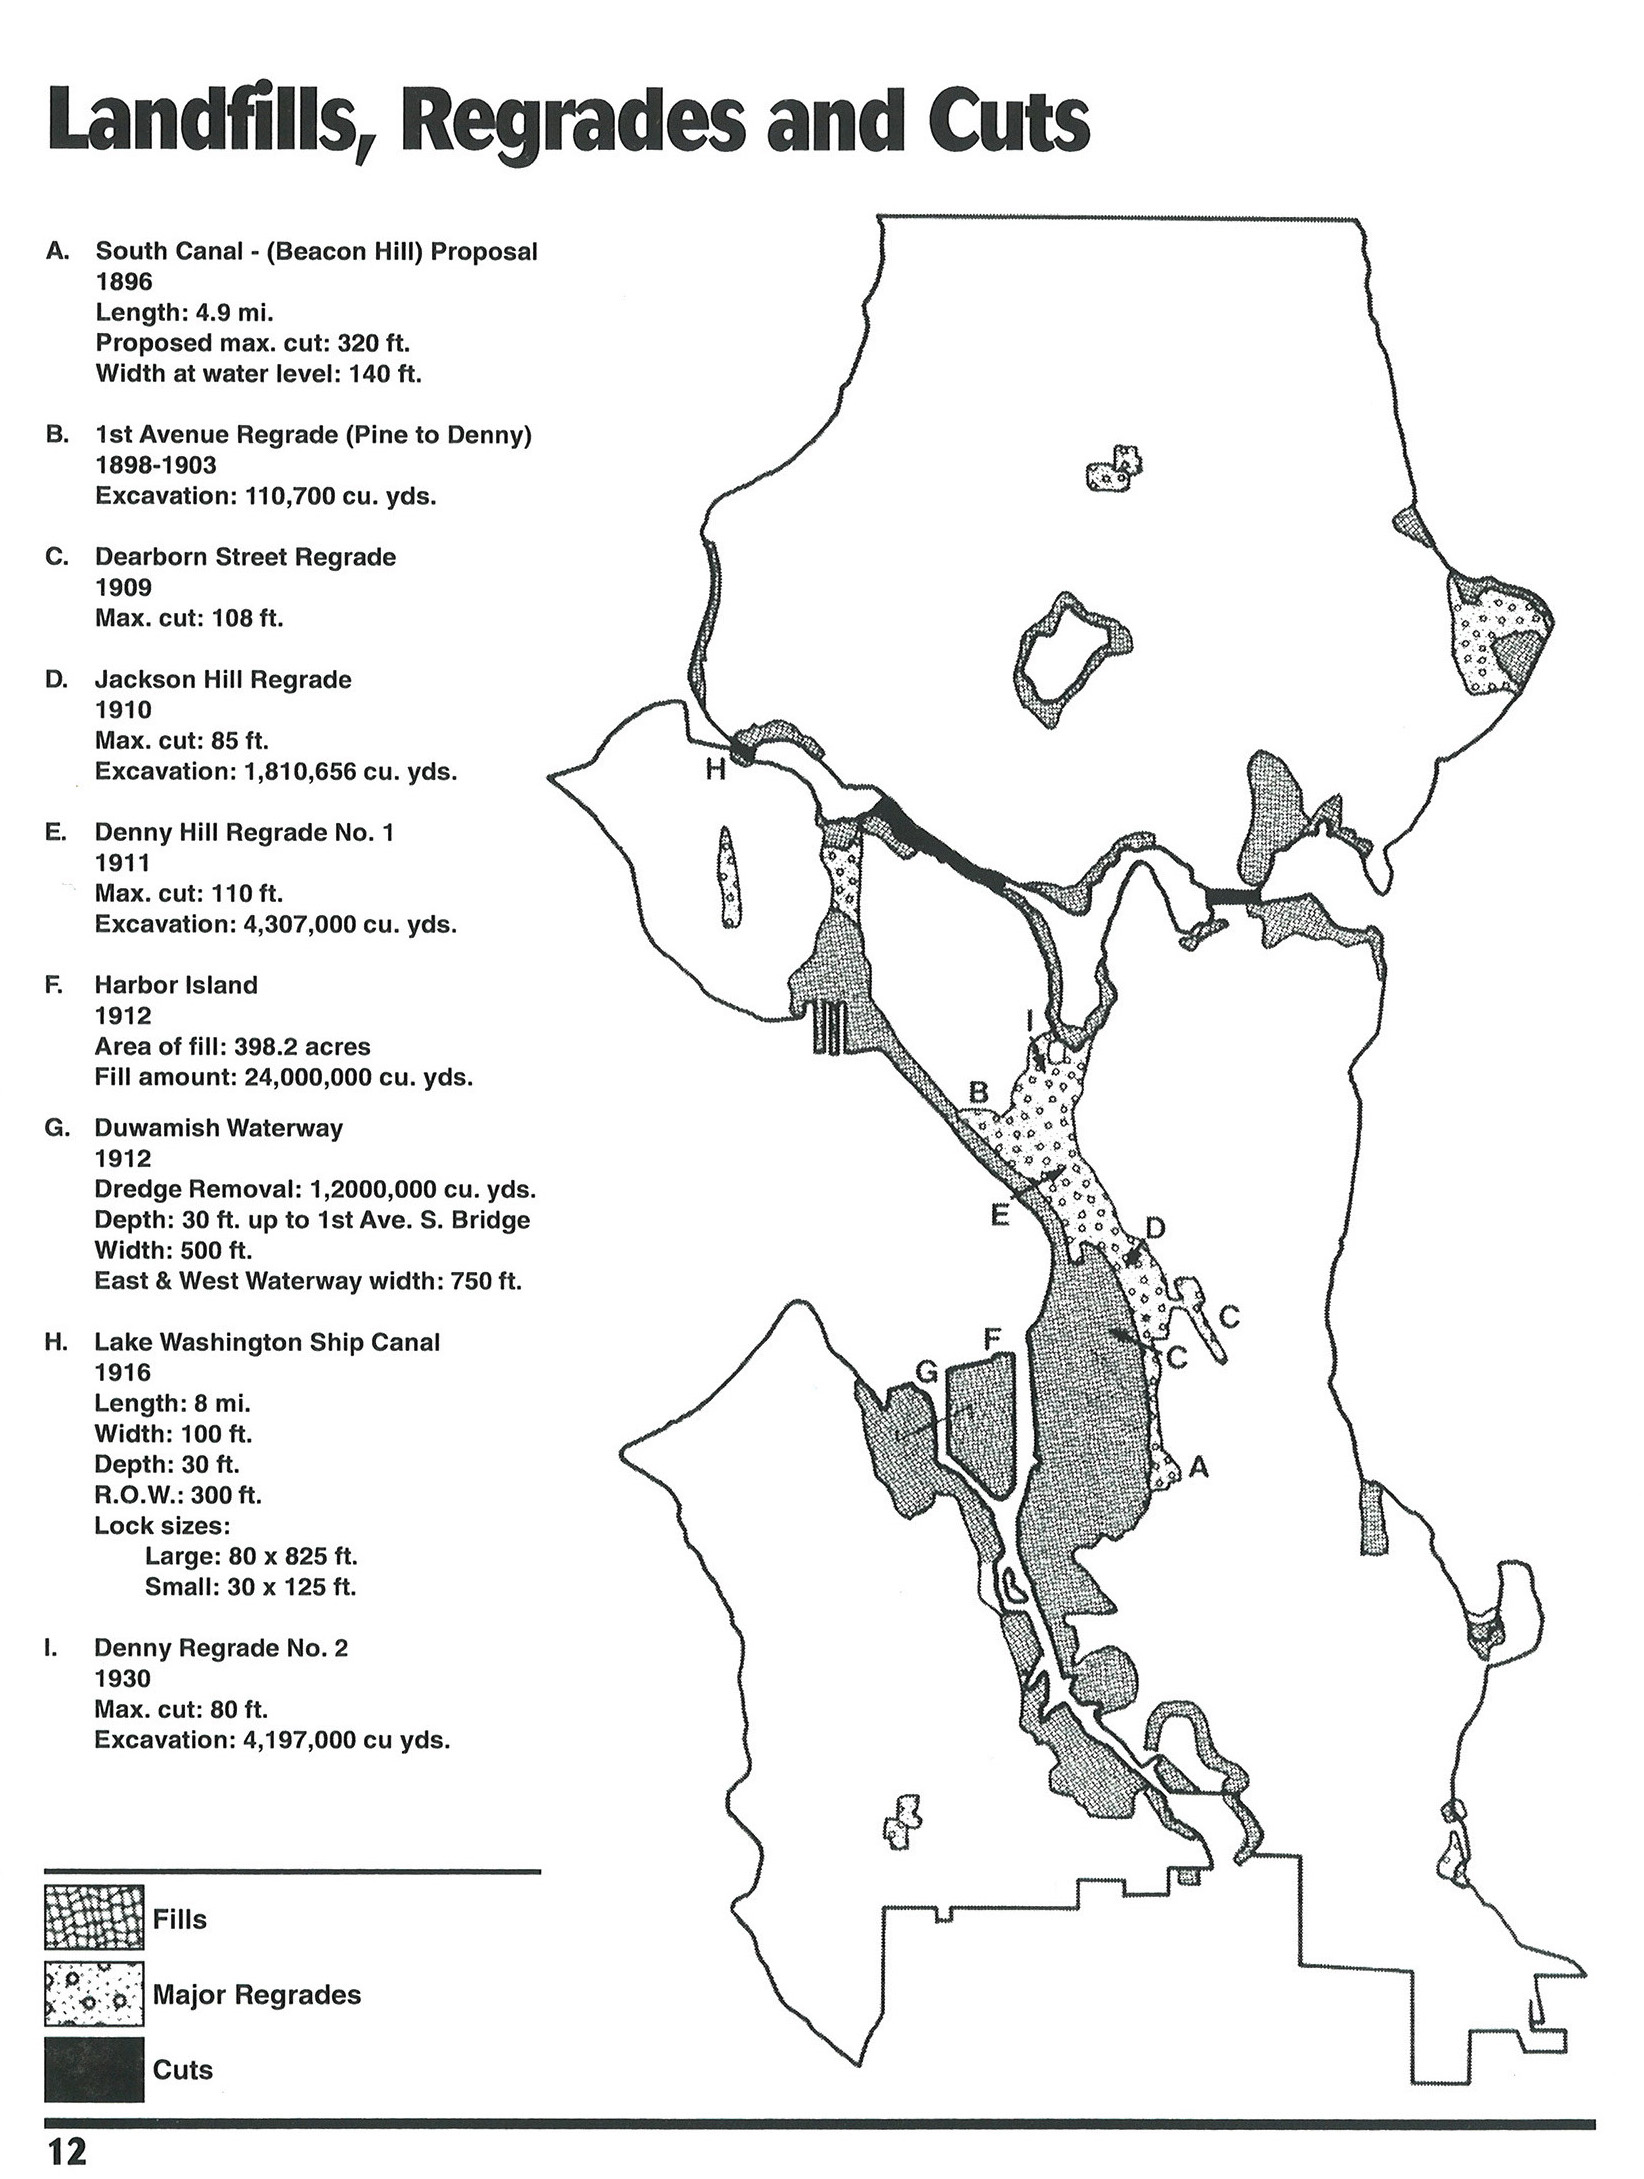
A quick one to show a map that captures the essence of the story of Seattle – this 1996 “Map of landfills, regrades, and cuts” outlines significant changes to the landscape of the city over the formative decades from 1896 to 1930. The source is the Seattle Municipal Archives, with a note of a source Seattle Engineering Department Digest, Special Commemorative Edition. A few interesting ones that aren’t labelled, such as the northernmost ‘Regrade’ which aligns in the vicinity of Northgate Mall and the wetlands around North Seattle College in the Thornton Creek drainage, and what I assume is also filling of the wetlands in the middle of Magnolia (just below the letter H). Also, while I get that there was some manipulation of Green Lake, I don’t think it’d be technically correct to refer to that as a fill, at least in the traditional sense of ‘making land’. It’s interesting to see these all captured in one figure. The impacts, of course, are well known.
A favorite precedent of mapping around water was the DC Water Atlas by John Davis, which explored historical waterways and some of the hidden layers of the hydrology of Washington D.C. in an interactive way. A recent mapping effort, The D.C. Underground Atlas by Elliot Carter takes a slightly different stance and approach, both in content and delivery, augmenting this previous effort and expanding the breadth and the way it is communicated via a series of interactive Story Maps. The thrill of peeling away perceptual layers of history and infrastructure interests many, which is reinforced from Carter’s introductory text:
“Washington sits atop an interconnected layer cake of transportation, utility, and pedestrian tunnels extending three dimensionally beneath city streets. Given their importance to daily life in the nation’s capital, it’s surprising to find that the full picture of Washington’s various tunnels remains unpainted. This project aims to complete that picture.”
While the previous effort by Davis was focused specifically on water, the new effort focuses on ‘tunnels’, in the sense that they are accessible. As mentioned by Carter “In order to limit the scope of the project, “tunnels” are defined as fully walkable passageways – no sewer pipes, culverts, or crawlspaces. All the tunnels depicted can accommodate standing adults, assuming that they have proper access credentials.” What are included are maps of multiple transportation modes, water, steam and sewer infrastructure, as well as pedestrian tunnels and the specialize subterranean elements supporting the Capitol Mall.
With a short intro page, the interface gives you the option of Maps or Text, each taking your through a narrative with images, text, and maps that shift and zoom and layer additional information to tell a story of each of the particular types of tunnels. For instance, the Sewer story starts with historical mapping with some information on the early sewage system, and then moves along a timeline, showing early infrastructure and how it evolves into more contemporary systems.
The sequence expands to show, with historical imagery, such as this showing the building of the combined sewer system in 1882 along with the major lines that were built at that time, and more recently a larger scale modern tunneling for new treatment facilities.
Obviously the focus on tunnels gives it a specific scale, and it’s not necessarily capturing the total water story, but showing the amount of subsurface infrastructure that exists, under our feet. The Aqueduct mapping leads more through the path of movement of water from source, with stops at major point, showing how you can adapt the Story Map to fit the particular type of infrastructure, in this case following a path.
For selected categories, the essays are more expansive, such as the breakdown of Aqueduct Tunnels, which expands the spatial narrative with some more rich history. One of those points is the use, like many other cities, of wooden water pipes, in this case one from around 1810.
A wooden water pipe from Pennsylvania Avenue, installed circa 1810. Photo: Army Corps of Engineers/Public Domain
Another is the great historical images of the brick aqueducts, such as these 9 foot diameter pipes leading to the Dalecarlia Reservoir.
Photograph in Peale album, Washington Aqueduct. PG.66.25.41.
And more diagrams showing cool images of some of the documents, in this case coded to show the type and material of tunnels and their depths as the Tunnel traversed the landscape. (click to enlarge)
Cross-section of the Lydecker Tunnel topography. The tunnel was advanced via vertical drop shafts at Foundry Branch, Rock Creek Park, Champlain Avenue, and McMillan Reservoir. Illustration: Washington Aqueduct/Public Domain
The story has multiple parts, remnants of abandoned infrastructure as well has a unique quality, such as the Sand Filters near the McMillan reservoir, in which “The underground vaults created their own weather systems when the sand filters were still in use, with internal clouds and condensation”
Photo: NPS/Public Domain
Lots more to explore here for sure, and if your thing is other, non water- types of infrastructure, this has lots and lots of layers. While the DC Water Atlas, as I pointed out had an exploratory, video-game like quality, this D.C. Underground Atlas has more of a linear spatial narrative that is more direct. Both have merits in making something that may be less compelling in an essay more engaging an accessible in map format. As a form of storytelling it’s great, and perhaps the best story comes in the form of daring subsurface navigation, mentioned in the article in CityLab,
“…Carter says the “single most epic Washington tunnel story” might be the adventures of Don Bloch, a Washington Star reporter who wrote for the paper for about a year. In 1934, Bloch convinced the inspector of maintenance at the pumping station to let him cross the city through its sewers for a Sunday feature. Equipped with a flashlight, rubber boots, and a gasmask, he hopped down manholes from street to street, with “cloud watchers” who would warn him if a storm might pose a risk from rising waters. Bloch’s tour guide shoved him in a trunk lid for a ride on the waters leading into Rock Creek. Carter says it might be the “best thing in stunt tunnel journalism Washington has ever produced,” but Bloch’s story remains sort of an enigma to Carter. One of the few details he has been able to verify about him: He co-founded the Speleological Society of the District of Columbia in 1939. No mystery there, it’s not much of a leap from tunnels to caves.”
HEADER: Historical Sanitary System – via D.C. Underground Atlas (www.washingtontunnels.com); this and all images in this post via the site