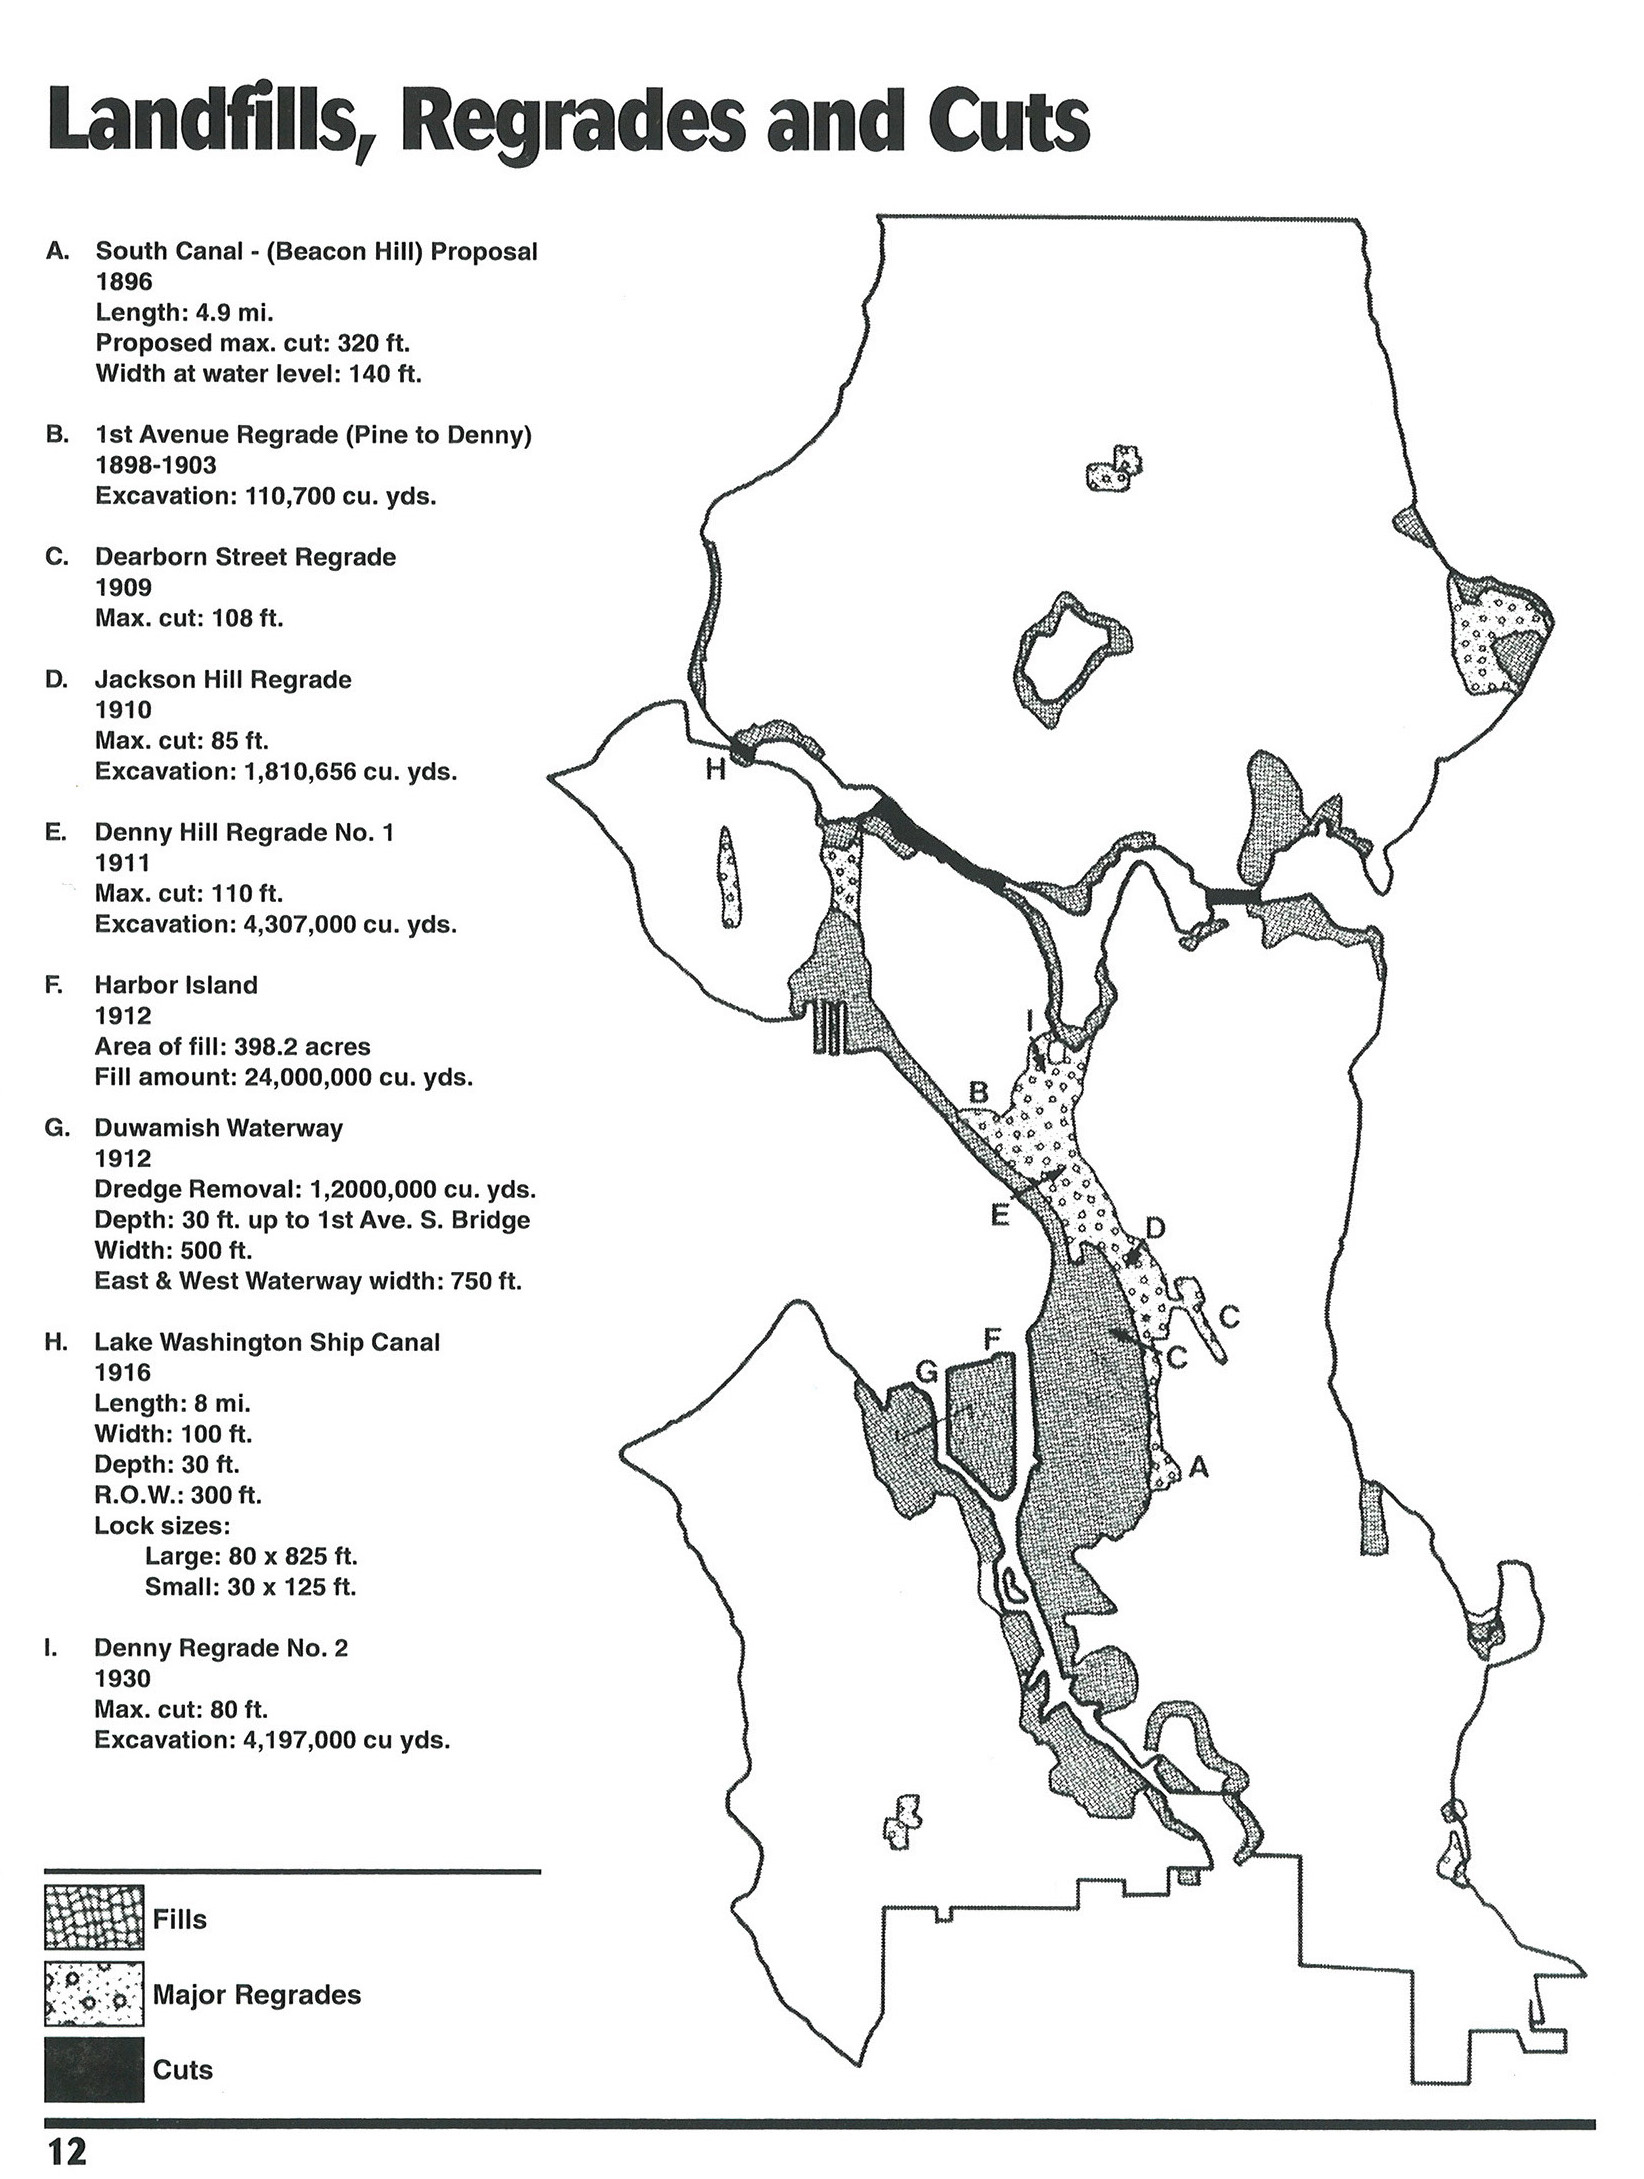
A quick one to show a map that captures the essence of the story of Seattle – this 1996 “Map of landfills, regrades, and cuts” outlines significant changes to the landscape of the city over the formative decades from 1896 to 1930. The source is the Seattle Municipal Archives, with a note of a source Seattle Engineering Department Digest, Special Commemorative Edition. A few interesting ones that aren’t labelled, such as the northernmost ‘Regrade’ which aligns in the vicinity of Northgate Mall and the wetlands around North Seattle College in the Thornton Creek drainage, and what I assume is also filling of the wetlands in the middle of Magnolia (just below the letter H). Also, while I get that there was some manipulation of Green Lake, I don’t think it’d be technically correct to refer to that as a fill, at least in the traditional sense of ‘making land’. It’s interesting to see these all captured in one figure. The impacts, of course, are well known.
I’ve been wanting to write about Seattle’s Green Lake, which is an addition to round out the post these small Seattle lake stories, and supplement the coverage of the larger lakes Union and Washington. Green Lake has a special place for me, having lived close to it our entire time in Seattle, it’s been a place for fun, recreation, and even protest. This really cool cross-time image from Then & Again shows the juxtaposition of the current with the old, and Green Lake spanning this , here with “…the majestic USS Macon gliding above Seattle’s Green Lake on August 22, 1934. The airship was traveling to its new station near San Francisco but took a leisurely route with time for a number of photo ops along the way.”
The history of the lake goes back to similar era to the smaller Bitter and Haller Lakes and the larger Lake Union and Washington, as mentioned on the Seattle Parks website: “Geologists say the Vashon Glacial Ice Sheet, which also formed Puget Sound and other area lakes, formed Green Lake 50,000 years ago. Dredgings of Green Lake have produced volcanic ash from an eruption of Glacier Peak that occurred about 6,700 years ago.” The original lake was lowered 7-8 feet as park of early 20th Century Park improvements, and this 2014 article from Seattle Greenlaker ‘Olmsted and the Origin of Green Lake Park‘ offers a good introduction to the modern incarnation of the park and this process. In that post, it links to this great map from 1907 from the National Association of Olmsted Parks, which shows the development of Green Lake Boulevard and the areas near the lake as part of this process, and the first evolution of Green Lake as part of the overall Park System.
Via Seattle Greenlaker – Caption: Courtesy Frederick Law Olmsted National Historic Site, National Park Service, 02714-21. Used with permission.
If you were, like me, temporarily disoriented for a bit, it helps to rotate this drawing so north is up, and the more familiar shapes and lobes of the lake become clearer. I’ve also highlighted the old shoreline (dashed line) and the new shoreline (solid line w/ blue fill), so it’s clearer where the drawdown left space for the trails and more usable open spaces, with amenities like Boat Houses and beaches. The map also has information on the inlets and outlets, which I’ve highlighted below in a bit more detail for reference.
If you remember back a bit to my post of the exploration of Licton Springs, the sketch above is instructive, as this inlet #1 shows an inlet with a specific reference: the “Brook inlet box culvert 2’x6′ from Licton Min. Sprg.”, showing the subsurface connection to the spring that had been filled in previously but was still flowing from the north. A Bathhouse is shown, which does not currently exist, but there is a swimming beach access which is still in place today, along with the splash play and some open spaces.
There is another pair of inlets #2 a bit further west, near Corliss Avenue, with a label “Inlet box 1 1/2′ x 2′” and near there is one with a note “Old Inlet 18″x18” wood box” which has a note “very little flow now – some sewerage seems to enter it now.”
The final inlet #3, is to the west, showing a connection to an “Inlet-brook, 6′ wide, 3″ deep” that comes from the northwest, running under the streetcar track in a culvert before coming into the lake.
On the opposite side of the Lake, heading southeast, there is the Outlet, which is marked #4, near 4th Avenue (a few blocks from the proposed boulevard which would become current day Ravenna Boulevard), which was the natural drainage of Green Lake into Ravenna Creek. The reconfiguration of this zone and the shift of the shoreline created a larger area that now has sports fields, as well as a boat house and what is a popular beach access spot today. This is also adjacent to the larger commercial zone which is the hub of activity adjacent to the lake.
These flows in and out correlates somewhat with the 1850s maps, but does closely align with the the USGS Topo Map from 1894 (see below) of Green Lake that identify three inlets from the north and the Ravenna outlet heading southeast – which does line up with the hydrology shown on these 1907 drawings.
Historical Topographic Map Collection
The formal plan as presented to the Seattle Parks Commission in 1910 mirrors much of the modern day condition, with the lowered water levels providing for perimeter trails, new plantings, a new island, some amenities such as beaches and boathouses, and the boulevard that rings the park (the western half of which was transformed with the routing of Aurora Boulevard (Highway 99).
And another version, this one from 1925 showing a more colorful version of this, “Proposed Plan for the Development of Green Lake” via the Seattle Municipal Archives Digital Collections. This map dashes in the existing and proposed shorelines
I posted previously about the fun bathymetry maps, which included Green Lake. Another map I like is this one ‘Showing Depth Contours of Green Lake’ via the Seattle Municipal Archives Flickr page, which was done in 1938 as part of the Sanitary Survey by the WPA and featured in the “Report on Green Lake Algae Control”, which highlights perennial water quality issue . It reinforced that the lake is relatively shallow, with maximum depths no greater than 25′ feet on the western edge. It also identifies some of the hydrology, including overflows, intake from the City resevoir, and to the west, a “permanent inlet from deep springs” which is a fascinating addition both due to it’s mystery and also it’s location, which is not shown on later maps but does appear in the 1950s map.
The history of the lake beyond that Olmsted plan has many facets and this Chronology is helpful to see the evolution. There many tales (and History Link is a great resource here) that connect with Seattle history, such as in 1869, when David Denny “…kills what is likely the last elk in Seattle, near Green Lake. The elk weighs 630 pounds.”, or 1893 when a cold spell froze the lake completely over. including of Hydroplane boat races in the 1930s, as well as a cleanup and redesign in 1936. Lots of history and evolution I won’t get into here, as it’d take days, but my favorite lost part of the Green Lake history, which I only discovered by accident after visiting the park many times, is the Aqua Theater, built in 1950 on the south edge of the lake as a 5,500 seat performance venue, built in a little more than two months coinciding with the first of what is now an annual Sea Fair.
The venue hosted a range of events included the annual Aqua Follies, which included ” Water ballets, diving exhibitions and clown acts took place in the pool and on the stage behind. Many of the Aqua Follies mermaids were recruited in Minneapolis before June 1, and began practicing before Seattle area college students finished their school term.” There were some notable music shows including 1969, which featured Led Zepplin and The Grateful Dead, which was one of the final shows at the venue before it was shut down.
The lake as a locus for recreation has stayed consistent over the years, with lots of walkers and joggers circling the 3 mile loop, along with water access via boat rentals, rowing, and use of adjacent open spaces sports fields, and even a Par 3 golf course. Water quality issues are a perpeutual issue, but it doesn’t stop it from being the busiest park in the state of Washington, with over a million visitors a year.
Postcard circa 1950s – via Seattle Greenlaker – https://www.seattlegreenlaker.com/2017/06/green-lake-seattle/
Some news on the project front, which partially explains the slow output on this end lately in terms of hidden hydrology updates: I’m moving from Seattle back to Portland. As regular readers know, the project origins are firmly rooted in Portland, including plenty of documentation and expansion of ideas around Tanner Springs Creek (seen below), and maybe I will finally track down one of those elusive ‘I Kayaked Tanner Creek‘ t-shirts of legend. Anyway, happy to announce this news, and Portland folks, let me know if you’re interested in some exploring in coming months.
There’s also a plethora of other areas to explore, and also to compare and contrast the unique dichotomy of Portland as a river city and Seattle as more of a ocean & lake city, and what that means/meant for development. On that note, one item I’ve not announced is some of the work figuring out the best format for a Hidden Hydrology Atlas that will span both Seattle and Portland – so stay tuned for more of this as technology and funding aligns. For now you can see the early version of the online example of interactive maps I’m testing out using a combination of Mapbox and my GIS database of information. Early days, but the potential is there, and it will expand into something more comprehensive and multi-media.
While I did get to explore a number of Seattle hidden streams, there’s so much more to do and lots to document for Ravenna, Yesler, and Green Lake, and hopefully coming back up to do more investigations. In the interim, one of my explorations I documented here in Seattle from last summer, Licton Springs, was the departure point for an essay I wrote recently for The Nature of Cities that was just published this week. Read ‘Map and Explore: Hidden Hydrology’ for some thoughts on exploring our places and connecting with our culture, geography and ecology.
So, stay tuned as projects, posts, and explorations will all pick up over the summer months. And as always, thanks for reading. See you all in Portland soon.
An email from a reader of the site posed a few interesting questions about the two small lakes in the northern sections of Seattle, specifically discussing the current and historical outflows of these lakes. I’ve discussed the small lakes in brief here, related maps of their bathymetry and tangentially in the context of Licton Springs. However, this was a good instigation to to focus on some more specifics of these urban water bodies. I will refrain from my tendency to write another way-too-long post (of which this will inevitably turn into) and parcel this out in a few shorter ones, the first focusing on drainage questions (of which these are all connected) and then individual posts on Haller Lake, Bitter Lake, and Green Lake, as they are important parts of the hydrological history of Seattle.
To understand the overall configuration of water in Seattle, I did find this document by Seattle Public Utilities (SPU) titled ‘City of Seattle State of the Waters 2007‘. The first volume covers Seattle Watercourses, (which we will probably return to in the future), and in particular for our purposes here we look to Volume II: Seattle Small Lakes’ (both links above go to the PDFs – as I couldn’t find a page with a direct link) and it sounds like a great resource in need of an update.
For some general contents, a bit on lakes in general and their outfalls, from Vol. II, p.3: “Lakes receive inflow from their surrounding watersheds through rivers, watercourses, overland and subsurface flow, and — in developed areas — from drainage pipes. Water typically exists a lake through a watercourse or river, although the outflows of most lakes in Seattle have been channeled into constructed drainage systems.”
HISTORIC DRAINAGE
In general, all three lakes are formed from Vashon glaciation, and as I mentioned previously, per geologist Stan Chernicoff, both Bitter and Haller lakes would be considered true kettle lakes, and Green Lake a hybrid, although still formed by glaciation. The 1850s map locates the three Lakes, all of which are in the north portion of Seattle, but doesn’t offer too much in terms of drainage direction, aside from implying proximity between Thornton Creek drainage for Haller Lake, and Bitter Lake likely draining west due to proximity, neither show a visible outfall creek.
Green Lake it’s more obvious, with multiple inflows, including Licton Springs Creek, and the very distinct outflow that drains through Ravenna Creek southeast into Union Bay.
.
The 1894 USGS map offers us the aid of topography, along with a bit more more comprehensive creek coverage. Bitter Lake hints at the possibility of outfalls either direction, heading to the northwest down to ravines that skirt The Highlands and the Seattle Golf Club and outlet near Spring Beach, and also draining southeast towards a seasonal drainage. Haller Lake (titled Welsh Lake on the map) also has no visible outfall as well, but adjacent creeks that are part of Thornton Creek drainage nearby, and a wetland area to the south make me infer that these would be like to be the natural drainage course of the lake.
Green Lake’s hydrology is a lot simpler to discern, with the similar inputs and outputs via the Ravenna outlet to the wetland zones near University Village and outlets into Union Bay.
TWO ALTERNATIVE THEORIES ON HISTORICAL DRAINAGE
One part I’ve always been a bit skeptical about in the USGS map is the location and extent of the drainage from Thornton Creek that looks to curve way west and intercept any south flow from the Bitter and Haller Lakes and direct it to the east to the larger Thornton Creek Basin. Licton Springs Creek also flows south, and is in reality much further north than shown on maps, and the interface between the two basins if filled with springs and wetlands, so it’s likely there could have been some disconnect between what was there flowing south, and what was mapped flowing east. However, Alternative 1 uses the basis of the map as the correct flowline, so shows both Bitter Lake and Haller Lake draining towards a seasonal creek and wetland that exists in the South Branch of Thornton Creek, and a smaller drainage picking up Licton Springs Creek draining into Green Lake. This mapped, overlaid on the 1894 map, shows an option for the lakes draining east, into Lake Washington. Dashed lines, for reference, are really basic watershed delineations, and the arrows show flow from lakes.
My gut is that both lakes flowed into Green Lake, via Licton Springs Creek, and then continued out to Ravenna. Alternative 2 looks at a version of this where there is more of a distinct ridgeline separation between the Thornton Creek Basin and the drainage that flows north south, and that the survey misinterpreted the flowline that heads towards the east due to the aforementioned springs and wetlands. The fact that the Licton Springs Creek is much further north than mapped, makes me posit that the upper lakes drained to this transfer point, and that instead of falling east, the flows kept going south into Green Lake, via the Licton Springs. Overlaid on the modern topography gives a bit of context to this configuration.
Both of these options are plausible, and the current outflows of the lakes (seen below) support this, with Bitter Lake draining to the Southeast and Haller Lake draining West. This at least gives us the indication that these both flowed to the low north/south valley (where current Highway 99/Aurora Avenue runs), however, where they go after is still a bit of a mystery. My follow-up plan is to look at some Lidar or a DEM to provide a much clearer picture of the flowlines and ridgelines, which we can assume, much like the current topo, is mostly similar to its predevelopment configurations (i.e. places in Seattle where we didn’t move hills). This will go beyond this back of the napkin approach above and see if that higher degree of detail unlocks any new info.
CURRENT DRAINAGE
While it’s hard to determine the exact nature of pre-development drainage on these lakes, we can infer much from these historic documents and topography. The current system is more clear, although not visibly inherent due to the modernization and piping of drainage through large intercepter sewers – in this case the Densmore Avenue Drainage System, which runs north/south around the low flowline at Aurora Avenue (Highway 99).
The first hint of the split of drainage is in the State of the Waters, where both Bitter Lake and Haller Lake fall outside of their adjacent drainages going west to Piper’s Creek and east to Thornton Creek. Figure 1 from the report shows a narrow band that is bisected by this linear north south zone, with both creeks located inside the boundary.
A search for the nature of this basin configuration is somewhat frustrating, mostly as it seems to be specifically not related to a creek so isn’t referenced as a watershed in the same way. The SPU site on Urban Watersheds breaks down the city into four distinct areas of drainage, including the Puget Sound, Lake Washington, and the Duwamish River, as well as this uniquely land-locked zone we’re focused on, known as the Ship Canal/Lake Union basin
This is subdivided into some smaller sub-basins,including the Ship Canal Basin, the South Lake Union, and our zone, the North Lake Union Basin, which stretches up to the northern lakes, in that same narrow band, encompassing their drainages, then around Green Lake, and south to the interface with Lake Union.
The specific acrobatics that the Densmore Basin does to get down to Lake Union is hinted at but there’s not a lot of great maps, in particular the last section which . This excerpt from the Seattle Comprehensive Plan Update Draft EIS from May 4, 2015 shows the ‘capacity constrained’ condition. but does highlight the basin and it’s
I dug a bit more and found another mystifyingly badly interfaced GIS portal, this time Drainage Basins layer from City of Seattle, embedded below. Again, need to download the data and have a bit more freedom to sort it out in order to display it in a better way, but you get the idea from this map (especially if you zoom in on the areas below Green Lake, and can see the basin outline snaking in a thin, gerrymandered strip beside I-5.
The lakes themselves fit within the infrastructure systems, as seen below. The City of Seattle Water and Sewer Map , which I thought would be helpful but really isn’t because you have to zoom way in to show pipes and so lose context, so it doesn’t clearly articulate the drainage system elements enough to isolate (i included a few screenshots), so probably need to get some GIS files to draw these and separate mains, branches, etc. to isolate systems, but the narratives are pretty clear in explaining the outfall scenarios.
Haller Lake, which is around 15 acres of drainage, and has a maximum depth of 36 feet, get’s inputs from adjacent residential drainage areas (280 acre drainage), now drains via the Densmore system, as mentioned in State of the Waters, Vol II, the lake “…discharges through an outlet control structure on the western side of the lake, eventually draining to Lake Union via the Densmore storm drain system.”
Bitter Lake, measures 18.4 acres with a max depth of 31 feet, draining a smaller area (159 acre drainage). This lake is also being drained into the Densmore system, from the State of the Waters, Vol II, page 25: “At its southeastern end, Bitter Lake drains through a piped outlet that runs through a series of small ditches and culverts before entering the Densmore storm drain system on Aurora Avenue North. The Densmore system is equipped with a low-flow bypass, which conveys runoff directly to Lake Union. Under high-flow conditions, runoff passes through Green Lake before discharging to Lake Union.”
Green Lake, has a surface area of 259 acres, and a shallow depth, maxing out at around 30 feet, drains a basin of 1875 acres of surrounding area, as well as getting inputs from the Densmore system, as mentioned above. Alas, it now no longer drains into Ravenna Creek, but is diverted, per the State of the Waters, Vol II, and“now discharges to Lake Union through a single outlet located near Meridian Avenue North. In the past, Green Lake also discharged to the combined sewer system via a number of outlets around the lake. However, these outlets were recently blocked and now are used by Seattle Parks and Recreation only during rainstorms of long duration when the Meridian Avenue North outlet is not adequate to maintain water levels in Green lake.”
A fun story about an interesting project being developed to provide a version of street view, only for rivers. From the story on knkx, “‘FishViews’ Mapping Tool Provides Virtual tours Of Local Rivers” which announced they had “…just finished mapping its sixth Northwest river, the Stillaguamish. Other tours include Lake Washington, Lake Union, Shilshole Bay and the Locks. They’re all enabled for virtual reality headsets and you can cruise along at your preferred speed, or zoom around the panoramic images with your cursor, like you might on Google. You can even take a peek underwater. There’s definitely a “gee whiz” factor.”
From their site, FishViews aims to explore waterways and waterway data with virtual reality tours, but they also have a ton of other practical uses. Focus areas at this point include Seattle area and some more remote locations in the Cascade Range and Olympic Pennisula, including their first, the somehwhat recently dam-free Elwha River (seen in the header above). Additionally zones in Texas around San Antonio and Houston have also been mapped by the FishViews team. You can access via guess account, or sign up for full access to some of the info – and other than having to sign in over and over again, I’d highly recommend losing a few hours, as it’s a lot of fun.
The interface is powered through ESRI storymap format, so has a pretty intuitive user experience of selecting through map icons or on a slider, with the ability to search as well. Lots of these early maps focus around the Seattle. One worth checking out is the Lower Duwamish, which encompasses the lower 12 miles of the Green River drainage, now so manipulated it lost its designation as a river and is now only “known as the Duwamish Waterway”. Each ‘tour’ has a bit of introductory info.
Probably few have the chance to boat the 12 mile stretch of the Duwamish, and it’s telling to tour the edges and discover the massive industrialization of the entire shoreline.
And also the moments of sublime beauty, which are reflected in a similar fashion to this previous post on the Duwamish River from the book ‘Once and Future River’, such as what may be the longest waterfront facade without a window, to the industrial beauty inherent in this context.
The access to metrics is sort of an interesting take, with a variety of info available in a pop-up, such as resistivity and conductivity, dissolved solids, temperature, salinity, and dissolved oxygen, as seen below for the Duwamish (at least when this data was being collected).
A few more shots, including the area connecting the Ship Canal to Lake Union.
And for smaller lakes, a nice coverage around the shoreline of Green Lake – also showing, similar to the beauty of Street View in capturing art – there’s some amazing shots of these aquatic resources as well.
In Portland area, they done an initial mapping of the Willamette, which is a nice tour around the city. An option as well to have the scene data in the lower corner also provides some context – but it drives a lot like Street View.
The ability to animate by linking the frames together is not a terribly enjoyable experience – although you can adjust frame rate. Think along the lines of a boat ride with a queasy stomach,but is a nice way to tour through a route to see what it holds. A view of the northern section of the Willamette shows this in action.
The underwater view is probably a lot more interesting in shallow water rivers and creeks, but pretty much looks a lot like this in both Portland and Seattle.
Although I was secretly hoping for robot fish, the technology for FishView’s capture technology is similar to information gathering for Street View, with a similar 360 camera rig, along with a variety of other sensors.
While the cameras are catching the views up top, they are employing some selective sub-surface cameras, as well as customized data logging equipment. Their process also does surveying and “…collects data below the surface. We deploy leading edge sonar technology for mapping, imaging, and exploring underwater. We use EPA standards for detailed water quality assessments and HD photography for below the surface insights. All tailored to our Virtual Reality Platform.”
The company also provides these services, per their site: “FishViews offers interactive 360° virtual tours and virtual reality for aquatic resource management. We incorporate a wide variety of hydrologic survey methods in order to produce a personalized, high-quality presentation that works specifically for your waterway data survey needs. From a stand alone 360° panoramic tour, to a comprehensive virtual reality model of an entire waterway, we create virtual platforms giving hydrologic data a home, complete with a custom-designed user interface. Our individual approach will ensure all your hydrologic survey requirements are met.”
The possibilities of this seems pretty intriguing. There’s obviously a scale aspect of , but the examples from Green Lake (seen in a VR snapshot above) Lake Union, and the Ship Canal and Locks and Discovery Park shoreline are all great explorations of urban waters in a way yet to be seen – a true key to unlocking some hidden hydrology.
And thanks to @pugetpeople for the tip on this one!
As I alluded to in the previous post on smaller lakes, the large Seattle lakes provide the form and contribute to the overall sense of place. River cities are shaped differently than coastal and lake cities, and the relationship with water differs due to this morphology. In either case, any urban waterway will exist in balance with many factors of urbanization, industrialization, influencing the ecological and social connections between hydrological and other systems.
In addition, because these larger water bodies exist in tandem with anthropocentric activities, they accumulate a mix of the odd and off-beat. And while I was excited about the idea of “Searching for the Mystery Sharks of Seattle”, those particular mysteries ended up a bit further outside the realm of our local water bodies. However, in Seattle, there is still evidence of some strange things in both Lake Washington and Lake Union, worth a bit of exploration.
One endeavor is the Center for Wooden Boats and their Underwater Archeology Project, starting in 2008. A good overview of this is the form of a post from 2011 by Dick Wagner “Beneath the Waters” recounts some of the finds, including a range of boats from back into the 1880s, as well as cars, motorcycles and even a Vespa scooter.
A video ‘Shipwrecks of Lake Union: Seattle’s Hidden History” the explorations from 2012: “This short video documents the Lake Union underwater archaeology project that The Center for Wooden Boats Founding Director Dick Wagner has been helping lead for the last several years. CWB is working with the UW’s Burke Museum, The State Department of Ecology, and others to locate and document vessels and other historic artifacts. Using the latest in underwater technology, divers and amateur archaeologists have been scouring the 40-foot-deep lake, looking at more spots where sunken vessels lie.”
The wreck of the J.E. Boyden, which is one of the finds of the Underwater Archaeology Project above, is located in the south part of the lake, “One of the oldest and best documented wrecks in Lake Union, the J.E. Boyden was built in 1888 and has been on the lake bottom since 1935.”
The Global Underwater Explorers Seattle group, which educates divers. From their site: “our exploration projects will have the ultimate goal of gathering consistent observational data and documenting the degradation or appreciation of our submerged resources over time. Through data analysis, we aim to drive policy-changing efforts to conserve, protect and create public awareness for our submerged resources” They also maintain Project Baseline, which is an interactive online map which displays bathymetry of Lake Union and Washington, with documentation of these wrecks as well as unknown and unexplored underway element. The Lake Union area in whole, which also shows the lake to be quite shallow, maxing out at about 40 feet at the deepest points.
A zoom in on the south section offers some interesting underwater topography, and the information about the Boyden, with a pop-up of info. Go to the map and check it out and you can see the distinct shape of the boat on the surface.
There’s definitely some novelty to the concept of shipwrecks, and the information appeals to a certain geeky longing that seems visceral to the water. As summed in the Seattle Magazine article there’s more to it that that:
“The effort to record these old wrecks is not simply a matter for scuba heads or boat geeks. Lake Union is the heart of Seattle’s maritime origins; filling in the story of its transformation from a pristine natural lake to a center for industry (including sawmills, brick making and boatbuilding) to a recreation hub through photos and film is of tremendous value.”
LAKE WASHINGTON
As for Lake Washington, the significantly larger water body, it doesn’t take much digging to uncover a range of good stories and mysteries. A 2014 KUOW Story is a good starting point: “What’s On The Botton of Lake Washington? Planes, Trains And…” hints at the diversity of subsurface elements, including planes “ Lake Washington is like a treasure trove for old plane wrecks. There are at least seven at the bottom of the Lake. They’re a frozen piece of our wartime history, a time when mock air battles raged over these waters. Midair collisions would send airplanes crashing into the lake.”
SHIPS
One there’s no shortage of, much like Lake Union, are ships, many of them either lost in accidents, or purposely scuttled. Per the KUOW story, “…there are about 400 boats beneath the surface: ferries, barges, three Navy minesweepers, mostly in the shallower waters off Kirkland, where the Lake Washington Shipyards used to be. Now, it’s a graveyard for wrecked boats. “These are full-on, full-sized ferries on the bottom, right underneath all the yachts that are parked there now,” said diver Ben Griner, also aboard. As for the minesweepers, one day they were docked, the next they were gone.”
For as long as there’s been water and something staring into its depths, there’s been the desire to dive in and see what’s underneath. Overlapping with the Global Underwater Explorers (GUE Seattle), is the Maritime Documentation Society, (link is to Facebook, as their original link is bad) is one of those groups that do this on a regular basis, with a mission. From their page, it is focused on “exploration and documentation of existing, undiscovered, and natural historic shipwrecks. Our goal is to create public awareness and expand the wealth of history for present and future generations.”
Some good videos are also found via DCS Films, which is ‘Dedicated to Advanced Technical Diving and Underwater Cinematography’ is a good resource to see what its like submarine, and they have some info on Lake Washington Relics. A clip from a story from “KCPQ 13 on the artifacts of Lake Washington A joint effort of the Maritime Documentation Society, DCS Films, and GUE Seattle” offers a bit of the footage.
Similarly the afforementioned GUE-Seattle has some great info about explorations on their blog, along with the maps shown before. Some of the stories of the dives are a fun read, to understand that equipped with a bit of info such as a general location and some scans, the fun is in exploration. One such as this exploration of LW250, an unknown object, seen here in the bathymetric view.
And the interesting perspective of the side sonar imagery, seen below.
From the post: “We found a well-preserved wooden sailboat in good condition and it was a pleasure exploring it. As is true with most fish stories and dive stories, this was the most spectacular boat even found. It had a hole in the deck with treasures of very old bottles, ledgers of misplaced bank funds, police ID badges, a revolver, and an attaché case chained to the railing…..actually it had none of that, but it was as exciting as if it did. Just to be there on this boat that no one had ever seen was thrilling. The boat actually had a Washington state registration number and the last year sticker on the side was 1983.”
A snip of the GUE-Seattle Bathymetry shows part of the Lake (it’s a really big lake) showing a range of underwater explorations, and also the relative depths, as you see see beyond the east side tidal zones, the edge of Lake washington falls off sharply from the Seattle shoreline (on the left side of the map).
And while the shipwrecks are cool, I’m really fascinated with the bathymetric info as an interesting exploration of hidden hydrology that goes beyond creeks and rivers – especially as there was so much manipulation of the Lake levels amidst the re-plumbining of the entire region, this information provides some great clues to a history unique to a lake-shaped city.
AN UNDERWATER FOREST
My interest in this topic in general was piqued by the May 2011 KUOW story “The spooky, underwater forests of Lake Washington and Lake Sammamish”, which describes 1000 year old forests off the edges of areas of both lakes. Remnants of an 1100 year old seismic event, areas of these forests were discovered The caption helps explain this image : ” This image is a close up of the standing timber on the south end of Mercer Island. The image is generated using a side scan sonar towed behind a boat about 20 feet off the bottom. The trees are visible mostly from the shadows they cast.
There was a video I do recall seeing, but all the links now seem to be gone. It was bit disorienting, so aside from a glimpse of something tree-like, it was alot of darkness and blurriness, which makes one thin. Ben Griner of Coastal Sensing who explored the Lake via sonar and underwater is, quoted in the story “…describes the drowned trees off the southern coast of Mercer Island as a thrill to swim through (although he gets not everyone would see it that way). “It’s certainly a disorienting dive,” he said. “A lot of people call it really freaky. Other people describe it as exciting and interesting.” The lake is pitch black at that depth — and being underwater can mess with one’s sense of movement. Griner said it’s sometimes difficult to tell if the water is moving or he is, and divers often bump into things. “Because of how long the forest has been under water and how busy the lake is, most trees are just the trunks now,” he said. “It can be a little creepy, but it’s really fun to swim through the trees.”
From the Wikipedia page, the location of the underwater forests are located in yellow, adjacent to Mercer Island to the south, and another segment. Per the page, the earthquake from around 900 C.E. created “The landslides on heavily wooded land created “bizarre submerged forests” of old-growth timber, preserved by the cool water and low oxygen in the deep lake.[1][5] These sunken forests were known to early European settlers of the Seattle area, for whom the snags could be a hazard to ships on the lake, and as early as 1919, nearly 200 of the sunken trees had been removed from depths of 65–132 feet (20–40 m)”
David Williams, who does his usual engagingly thorough job of discussing this topic back in 2014 on a post “What Lies Beneath – the Secrets of Lake Washington” discusses ships, and these Submerged Forests as well, explaining a chapter in the story (also mentioned in the KUOW story).
“Mostly forgotten, the trees merited public attention in the 1990s. In 1994, John Tortorelli was caught salvaging wood from the submerged forests. Unfortunately for him the state Department of Natural Resources owns the trees, plus he damaged an underwater sewer line. Found guilty of three counts of theft and three of trafficking in stolen property, Tortorelli received a jail term of three and a half years”
The post includes this map, highlighting the locations of the souther sections identified above.
COAL CAR ENDNOTE
As many discussed the other submerged worlds of ships and forests, both the KUOW article and David Williams mention coal cars on the bottom of the Lake as well. Williams elaborates on the the eastside coal connection, which saw a constant stream of “… coal was loaded on railroad cars at Newcastle and lowered 900 feet by tram to Lake Washington, where the cars traveled on a barge to Union Bay and then on a tram over the narrow neck of land now crossed by SR-520. A second barge carried the coal cars across Lake Union to a train (Seattle’s first) that carried the coal its final mile to a final tram, which lowered the ore down to a massive coal bunker at the base of Pike Street. It was on one of these trips across Lake Washington that the barge dropped its load of coal cars now sitting at the bottom of the lake.”
With that frequency, the accident was bound to happen. To verify this concept, a cool shot from Coastal Sensing shows the scattered remains of perhaps these same “Coal Cars in Lake Washington Seattle. Lost in a storm while transporting coal from Coal Creek to the small city of Seattle.” (read more about this here).
There are some that shape Seattle, including Lake Washington to the east (see above header image), a massive 21,500 acres of lake area and a max depth of 214 feet, draining a watershed of over 550 square miles and defines the entire inland edge of the city. In the medium size category is centrally located Lake Union, (below) which encompasses 580 acres, a max depth of 50 ft, and a similarly larger watershed. These, along with the Salish Sea to the west, and the Ship Canal and locks, literally form the hourglass shape of the City of Seattle and make up much of the story of the city in terms of water.
Nautical charts aside, we will have plenty more to come on these in terms of history and form, as well as some new efforts that have unlocked some mysteries hidden in their depths. For now, In addition to these large lakes, there are a number of small lakes that dot the landscape, remnants of the glacial action, namely in the form of kettle ponds. King County has a site for Lakes Data and Descriptions, which includes both, but of particular interest is the page for Small Lakes Data and Info, which allows access to information on these lake, including some simple yet compelling bathymetric maps. Green Lake falls into the small lake category (and also has been plagued with water quality issues. The bathymetry shows the current shoreline, which has a lake surface of 259 acres with a contributing watershed (although no contributing streams anymore) of 1875 acres.
For a slightly different visual,this 1938 W.P.A Sanitary Survey map (via the Seattle Municipal Archives page) shows a color coded look “Showing Depth Contours of Green Lake as of 1936”.
Those familiar with the story will know that the shoreline of the lake was changed a bit around the turn of the 20th century, and the addition of the waterfowl named island by said WPA also was not an original, but more on the historic manipulation of the shoreline of Green Lake at a future date.
For now, another interesting resource on the King County Lake site charting of various lake metrics, including water quality. As I mentioned, water quality issues, mostly in the form of toxic algae growth, have been problematic in Green Lake, with a peak issue in 2013 and a spike in 2016 Some historical data shows the situation in 2016, which shows a spike in Chlorphyll-a, which is an indicator of algae growth, and subsequent nutrient and temperature charts.
The smaller lakes in North Seattle also appear, including the smallest (yet deepest) Haller Lake, which has a surface are of 15 acres, with a max depth of 36 feet.
Bitter Lake has a surface area of 19 acres with a depth up to 31 feet.
Both are probably similar in size today as they were in the 1800s, based on the historical maps. The land uses and while the land use has changed, also probably have similar catchment zones. Maps on the site outline these watersheds, for instance the 331 acre drainage of the lake. As mentioned on the site: “This map shows the area of the watershed relative to the area of the lake. Generally speaking, the larger a watershed is relative to a lake, the greater the influence land use practices on lake water quality.”
An interesting tidbit on this was discovering the amazing Lakes of Washington by Ernest E. Walcott published in the early 1960s which was the basis for much of the bathymetric info included on the King County site and other resources. I’ll expand on at a later date, but in that vein, while outside of the city proper, the range of bathymetric maps, so I snipped a few pages out of this document, which includes lakes in King County that are part of the Lake Stewardship Program – just for a flavor of different lake forms in comparison (at least formally, as they do vary in scale) – all of which are derived from the work of Wolcott.
And if you still need your Lake Washington bathymetry fix, one I did find, for the more artistic (or looking for a gift for that special map nerd) are these fun wood fun maps (found amongst other local and national water bodies) sold on Etsy by ‘Beneath the Sail’
[1917]It was great see, via Twitter, local resource @HistoryLink post “100 years ago today, Thomas Phelps’s 1856 map of Seattle was published in the Town Crier”. I saw the post today, so I’m a day late, but the Phelps map is one of those fascinating documents that highlights the historical origins of Seattle and intrigues because it so far removed from want exists today. The article about the map, website, penned by David B. Williams, mentions the map’s original publication on December 15, 1917 as part of the article in the Town Crier (map shown to the left). The article was about “Seattle’s First Taste of Warfare”, found via the Seattle Public Library which outlines an early battle between new settlers and the original residents of Seattle. The full page shows the map in the center (quality of the online version is a bit fuzzy as well – click to enlarge)
The history is summed as such by Williams via HistoryLink.org:
“Phelps’s map depicts what has become known as the Battle of Seattle, when Native Americans battled settlers and the Decatur’s crew on January 26, 1856. The death toll for the skirmish, which ended at 10 p.m., was two settlers and an unknown number of Indians. The map provides what appears to be an accurate depiction of the city on that day, although there is one notable mistake. The settlement’s northern blockhouse, or fort, is in the wrong location; it should be two blocks south, at what is now Cherry Street. (Phelps also shows a southern blockhouse, which was not built until two weeks or so after the battle.) The only other map to depict Seattle around the time of the battle is a U.S. Coast Survey map of “Duwamish Bay, W.T.” Published in 1854, it shows a roughly similar landscape and distribution of buildings.”
[1908]A known reprint appeared inr Arthur Denny’s book “Pioneer Days on the Puget Sound”, originally published in a 1888, this map appearing in a reprint from 1908 (but also great is to see the book available as a Third Place Books Rediscovery Edition here). A small version of the map of it from HistoryLink.org (see below for a larger, adapted similar version), with caption from Williams: “1856 map of Seattle by Thomas Phelps of USS Decatur, as published in Arthur Denny’s Pioneer Days on Puget Sound with later street grid superimposed, 1908”
Many historical maps just exist as a singular object to depict a place in a point in time. Phelps’ map seems to exist along a continuum from it’s original sketch of which there is no record, to various prints, updates, hybrids, and transformations over the span of decades, all of which are adaptations of events that had happened some half-century or more in the past. As Williams mentioned separately in a blog post, on his GeologyWriter site about the map: “Many, many editions of the map have been produced.”
The other version that has a fixed date, and mostly commonly used as I’ve seen it, is that redrawn version by Clarence Bagley from 1930, recreating the “1856 map of Seattle by Thomas Phelps of USS Decatur, enlarged and revised.” The 1930 version shows the “Officers of the Sloop of War Decatur”, and a more extensive street grid, and is signed by Bagley. (This image is from Pinteresthere as finding a good digital original with source is tough) There’s also a sepia version around cropped with tape marks and a big seattlepi.com watermark, but the same map.
[1930]As Williams outlines the unknowns and uncertain history of the map deftly in his article, he mentions “We do not know why Bagley produced this map, who he produced it for, or how he distributed it. Nor is an original of it known to exist. Copies are found in the holdings of Seattle Public Library and University of Washington Special Collections. Nor is it known how Bagley acquired a copy of the Phelps map. Perhaps he could have acquired it from whoever supplied the map to Alice Harriman, who published it in her 1908 reprint of Arthur Denny’s Pioneer Days. Bagley had originally published Pioneer Days, in 1888, but that edition did not include the Phelps map. Harriman did consult with Bagley so he may have had access to an original, though it is unclear why Bagley would wait until 1930 to produce his edition of the map.”
The provenance of others is a question, below is one of those alternative versions that just includes some format changes but unknown date, and stripped of the additional information added in 1930. This larger version via DorpatSherrardLomont that also points out one flaw in the original, as included the annotation: “Phelps map of Seattle. He by now famously misplaced the blockhouse one block too far north of its real location on a knoll at the waterfront foot of Cherry Street.”
The map shown below is titled ‘Map of the Attack on Seattle’, which alludes the the original story. In this case it is from Access Genelology site for the Washington Indian Wars, 1855-1856. It looks like a version of the original that uses the same graphic style, in a sepia tone that cleans up the original map with updated fonts, and the titleblock shifting to the upper right (not sure about date of this one)
An alternate version that David Williams has on his blog, and as he mentions, “This is one of the more unusual. It is owned by the University of Washington Special Collections. I have no idea where it was printed or who the engravers were.” adding, that there were “…several unusual aspects. 1. Addition of “hostile” to Hills & Woods thronged with 2. Addition of “skidroad” to Lake Trail & Skidroad 3. Labels Thomas Phelps as a Lieutenant instead of Commander” ( date unknown)
This expanded version from DorpatSherrodLomond locates the original map within the larger grid of streets and pioneer claims, using the original graphic style as published in Denny’s book.
I’m sure it’s not uncommon, but it’s one of the interesting aspects of the map, as summarized, that it is not just a snapshot of an event in a place, but that it has yielded lots questions about copyright in later years between those wishing to use the map for publication. Williams concludes: “For such a famous map, there are many unanswered questions: When exactly did Phelps draw the original? Does an original exist?”
And for me, when looking at a map that provides a foundation for a place, the questions are both fascinating and make one questions the fidelity of memory, production, reproduction and tracings. Whole explicit or accidental it shows the agendas (and talents or lack thereof) of the mapmakers. The story of the Phelps map is a crucial one for Seattle history and hidden hydrology, and it does offer some context for early shoreline and land fill to office later. While we’d like highly accurate and globally positioned map or story, often reality is that we get a different, more subjective and fluid tale. And as it is a touchstone to what ends up being a crazy development of the City of Seattle, perhaps a little mystery isn’t such a bad thing.
Original text quotes from “Thomas Phelps’s 1856 map of Seattle is published in the Town Crier on December 15, 1917″ via HistoryLink.org, by David B. Williams, originally published 3/24/2015. Maps are credited to other sources because they are so incredibly small on the HistoryLink.org site to even be legible (one of my few pet peeves with an otherwise amazing resource).
David’s site Geology Writer also has more history, and tons of great info on Seattle History, by Paul Dorpat, Jean Sherrard, and Bérangère Lomont on the DorpatSherrardLomont site.
The distant fourth and final part of the Waterlines class featured the work of Eric Wagner and Tom Reese for their book Once and Future River: Reclaiming the Duwamish. I unfortunately was out of town for work during this session, so don’t have the specifics on their actual presentation but wanted to close the loop on the class and explore this last resource through looking at the book itself (although they may have talked about something totally different).
The Duwamish is a fitting addition to the discussions of Geology, Archaeology, and the Ship Canal previously discussed, as it is the one and only river in the City of Seattle. It, much like the Duwamish people, also best signifies the history of manipulation, exploitation and degradation, and the current challenges to restore both culture and ecology along this urban waterway. It’s also in sharp juxtaposition to the current boom, as summaried by Duamish Tribal member and director of the Duwamish River Cleanup Coalition, James Rasmussen: “We need to always remember that the wealth of Seattle was created on the backs of the Duwamish River and the Duwamish People.”
Wagner discusses this evolution of the Duwamish River and people along with the greater City of Seattle through multiple essays. They cover the inevitable growth leading the dispossession of the lands, the straightening and polluting of the river, the erasure of ecology and culture. It uncovers the long truth for Seattle about conquering nature, as has been discussed in the previous Waterlines lectures, here with Wagner mentioning it in the context of the Duwamish, “…to conquer something at least implies a respect for it… The Duwamish River cannot claim such dignity.”
Now not even a river (classified a “waterway”) and a toxic Superfund site, the idea of restoration is difficult to imagine. There is lots of hope and much work outlined in the book on the potential, in the words of William Jordan, to “heal the scars or erase the signs of disturbance.”
There are a few maps early in the text, showing the 1856 Map of the region prior to the mass of European settlement, next to the 1958 Map, which shows development and channelization and virtual obfuscation of the natural systems. As Wagner mentions, in the concept of restoration “In seeking such a reversal restoration becomes a question of time, and therefore a historical exercise as much as it is a moral or a spiritual one. What point in a river’s past should we aim for? When was it the best version of itself? What processes from that period can we bring back now?”
A theme of the book then is put at the beginning of the introduction:
“We strive for a past we have never known, having only read about it, or seen in in faded pictures, or heard of it in stories about an old, shadowed river that once ran so full of life and magic that it filled the people who lived on it with awe, terror, and love. When we arrived at that place — if we are capable of reaching it, if we can recognize it should we get there — we will have found a way of seeing something that has until now been ignored, dismissed, and very nearly lost: a river from end to beginning.”
Subsequent chapters cover the history of the River through a Salish parable called the “Epic of the Winds”, and the importance of this place in the life cycle for Chinook Salmon; land erasure and land making, the industrial heritage, large scale camouflage to win World War II (seen below, the ‘streetscape of a village draped on top of Boeing Plant 2 along the Duwamish, the facility constructing B-17 Bombers, to throw off potential attacks.
This patriotic and economic value of the altered Duwamish in Plant 2, Terminal and hundreds of other comes with a legacy of toxicity the persists and will continue for millenia. In further essays we learn about poet Richard Hugo‘s regionalist riffs on the Duwmaish, and learn about John Beal‘s tireless work to save Hamm Creek, and modern day restoration efforts including hatcheries. Will the River rebound? How long will it take? Who knows, but as Wagner mentions:
“…the Duwamish River has always been a place to test the surprising range of the possible. Settlers looked at acres of mud flats and forest and saw a city. City engineers looked at a floodplain and saw a waterway. Businessepeople looked at a waterway and saw a waste management system. Now, we look at a Superfund site and see a healthy river filled with fish that are safe to seat. All those earlier versions came to pass. Why should this latest not as well.”
While the first half is well illustrated with Tom Reese’s photos, the second part of the book is exclusively devoted to the photographs, capturing the range of themes, including the river itself, as well as the degradation and activities around its restoration. Bolstering the text, this beautiful, damaged place offers sorrow as well as hope. As Reese mentions in the Coda, “The Duwamish also informs our subconscious desire for connection and our intensifying undercurrent of worry. it can transport us to places within and beyond our own lives, reminding us what is precious, asking for our devotion.”
Some of the photos from the book are peppered through this post are also on his website, so peruse on over there to catch more imagery, or just buy the book because it’s a great addition and has even more images that you’ll come back to more than once.
An extended video probably will help fill in some of the blanks also – from about a year ago at Town Hall “…featuring Tom Reese and Eric Wagner, co-authors of “Once and Future River: Reclaiming the Duwamish”; James Rasmussen, Director of the Duwamish River Cleanup Coalition; and Lynda Mapes, Seattle Times Environmental Reporter”
Header image Copyright Tom Reese – “Last natural bend in lower Duwamish at Kellogg Island” – all other images, unless noted, are by Reese as well.
The first of what I hope are many field trips and investigations is now up on the site in a section called Explorations. This will be the location for these site-specific journeys, and will be augmented with maps, narratives, soundscapes, and images layered to tell the Water Stories of these hidden streams and buried creeks.
For this initial foray, in Seattle, it was immense fun to wander the areas north of Green Lake and discover the history of Licton Springs. As you see from the map below, the historic routes show a stream flowing southwards into Green Lake. The reach of the waterway starts around Licton Springs Park, where it is sees daylight for a stretch, along with some other intermittent segments where it pops up in surprising ways, throughout the neighborhood.
The story of Licton Springs focuses on the significance to Native Duwamish peoples, who celebrated the place and it’s spiritual, reddish, iron-oxide infused waters, and to early settlers, who lived and recreated, bathed in thermal pools, and bottled and drank of the healing mineral waters.
Like many places, the history of how the place evolved and how it was maintained is of interest, but the journey of the now and the experience of a day of exploring the edges, the muddy margins, and the sloppy seeps (lost shoes included) connect the history of place to the experience of today.
Beyond the park, there are a number of other discoveries that paint a story of people and place woved together through the flow of water. Discovery of the story of Pilling’s Pond, a small section carved out of the flow of Licton Springs to provide a sanctuary where Charles Pilling became a world expert duck breeding in the middle of Seattle.
The discoveries also include a unique segment of stream fronting Ashworth Avenue, a single residential block with driveways and fences literally bridging over the final daylit segment of of Licton Springs, showing how each owner shaped, or left feral, their little piece of the wild.
The connection as well with the virtual, with the final connection is made to Green Lake. Now only connected via overflow, the tracery of Licton Springs, imagined perhaps in some abstracted water play forms, swales, and cascades, may still be allow the creek to be evident, if only in our imagination.
The link below expands on this summary, so check it out, go out and explore, and come back with some water stories of your own.


 An interesting tidbit on this was discovering the amazing Lakes of Washington by Ernest E. Walcott published in the early 1960s which was the basis for much of the bathymetric info included on the King County site and other resources. I’ll expand on at a later date, but in that vein, while outside of the city proper, the range of bathymetric maps,


